What is Data Analysis?
What is Data Analysis? Collecting data, reviewing the data, and making inferences from the data is data analysis. Analyzing data is important in continuous improvement. Data allows you to make sound decisions about the process, product or service.
This Data Analysis Video teaches you the basic tools for understanding, summarizing, and making future predictions with your collected data. Includes MS Excel templates.
What is Data analysis? It is a scientific approach to improvement. Simple data analysis comes down to two terms. I talk about these two terms on this page.
Data comes from everywhere. There is process data, product data, financial data, mechanical data, electrical data, and service data. Every organization improves with their own set of data. If you can’t measure it, you can’t improve it.
The best thing about data is that most data follows the same patterns. Simple statistics can be used to analyze the data. The term statistics seems to scare people. But really, it is quite simple and data analysis in excel is easy.
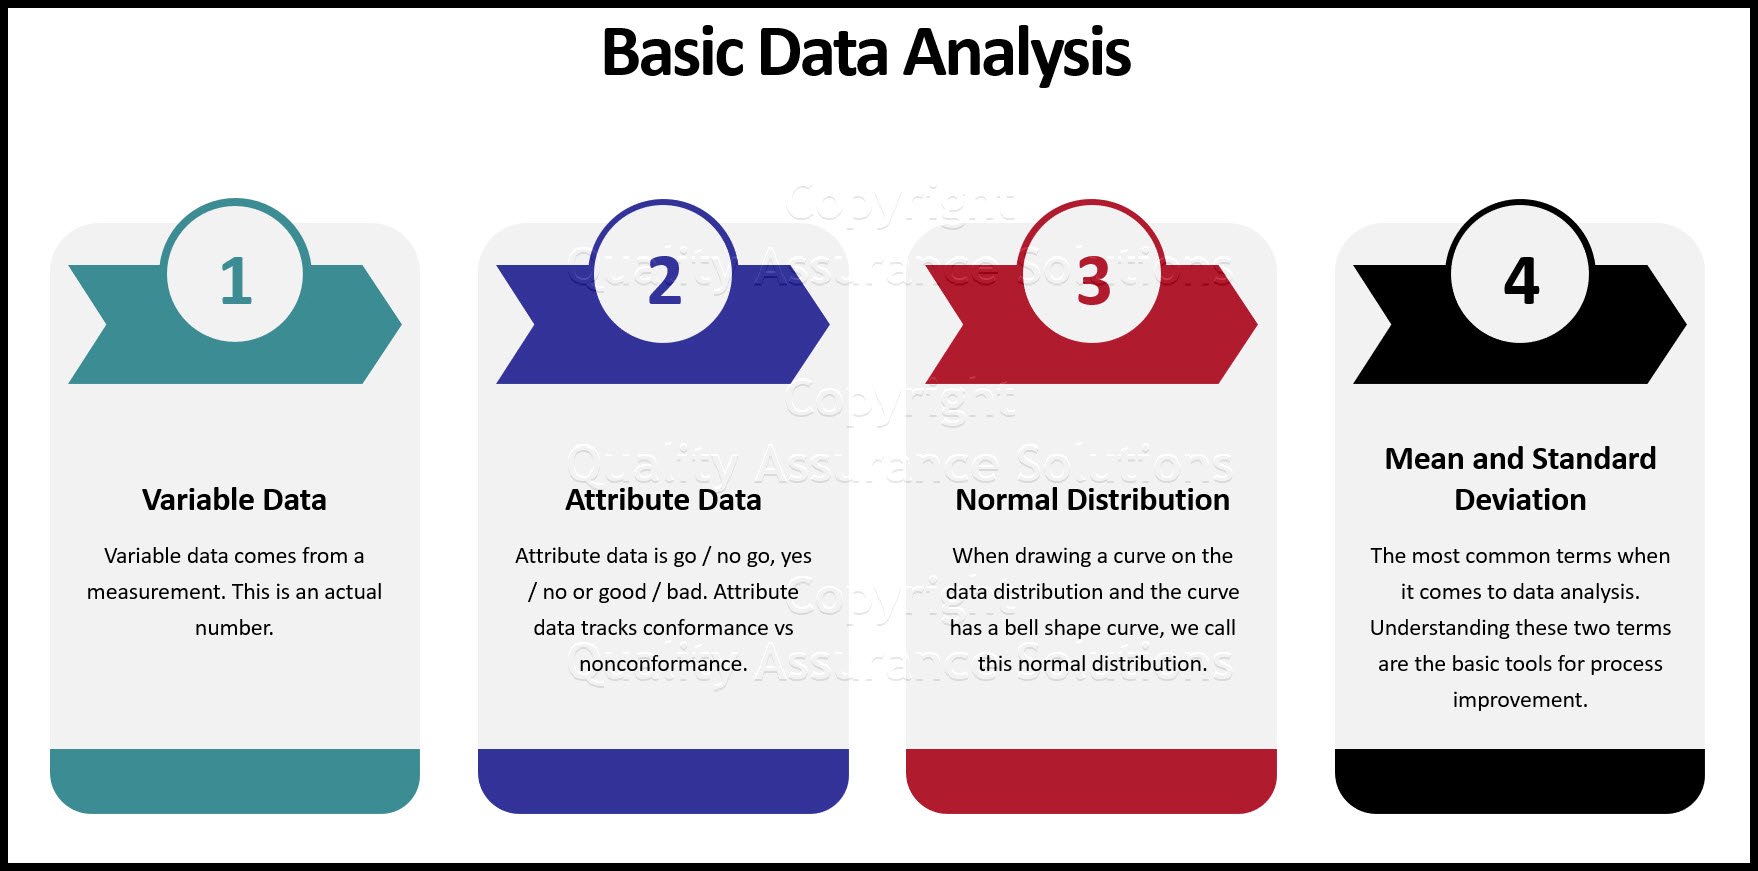
Let’s start with the types of data. There are two types of data.
- Variable
- Attribute
To answer the question - What is data analysis? You have to understand the difference between these two types of data.
Variable Data
Variable data comes from a measurement. This is an actual number.
Examples of the measurement include test scores, weight, length, width, thickness, sales dollars, profit, cycle time, pH, plating thickness, tensile strength, tension, diameter etc. Cad drawings will have many measurements. Financial data includes purchasing costs, sales volume, profits, sales growth etc.
Attribute Data
Attribute data is go / no go, yes / no or good / bad. Attribute data tracks conformance vs nonconformance. It is used when classifying defects. For example, a manufacture that makes glassware may classify defects as broken glass, thin glass, scratches, misshaped, etc.
The result of a variable data measurement could be an attribute. Lets say your measuring the glass thickness and the glass measures below the specification for thickness. You call this defective glass as thin glass. You reject the glass for thin glass. Thin glass is an attribute.
Suppose you measure 100 glasses for thickness and 10 of them were thin class. Then the attribute data for the 100 glasses are 90 are good and 10 are defective for thin glass.
This Data Analysis Video teaches you the basic tools for understanding, summarizing, and making future predictions with your collected data. Includes MS Excel templates.
Variable Data Analysis
The first step of data analysis is to collect the data. Below is a table of the length of a 2 foot speaker. I went out and measured 100 units of a total of 1000 speakers. The unit is in inches.
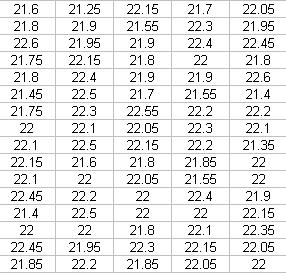
What is data analysis or what can we infer from this data? Well, there are many points in the 21 and 22 inches. That is about it.
To make more sense of the data we need to sort it. The below table sorts the data from low to high.
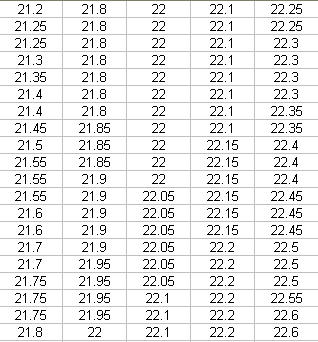
This Data Analysis Video teaches you the basic tools for understanding, summarizing, and making future predictions with your collected data. Includes MS Excel templates.
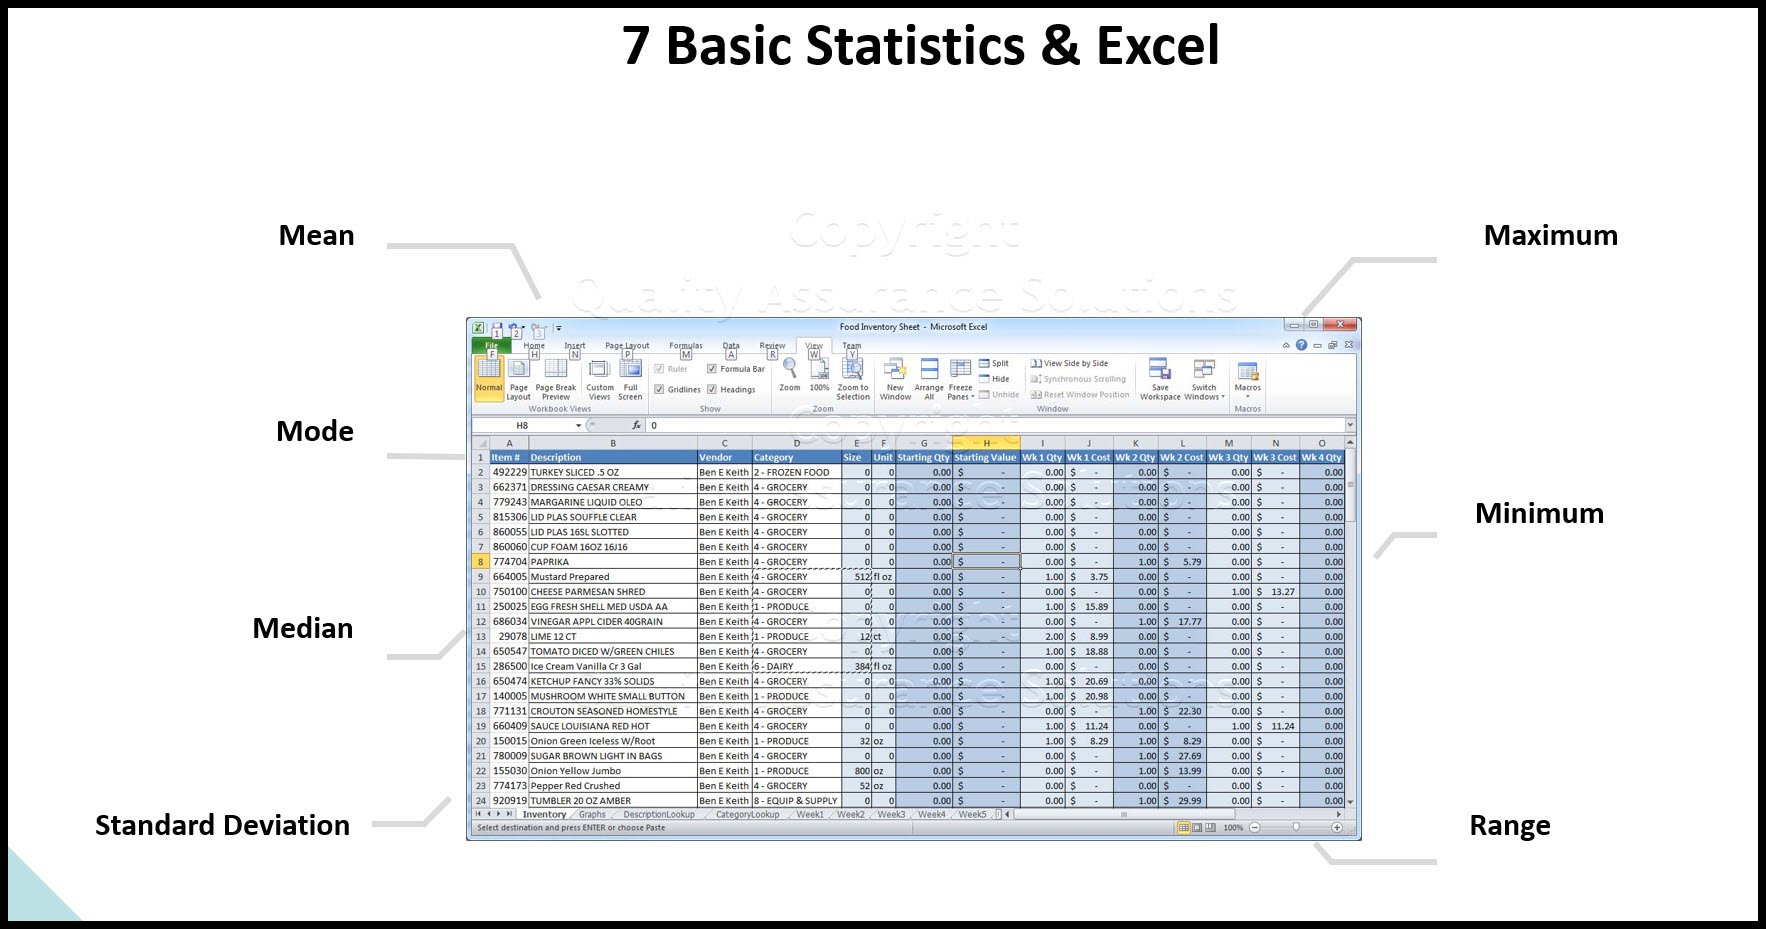
The first statistical term that we can easily calculate is the range.
Range: = Maximum – Minimum or 22.6 – 21.2 = 1.4
The next thing we can calculate is the average. The average is the center point of the data. There are three types of averages
- Mean
- Mode
- Median
The most common average used is the mean.
Mean : Sum of all the numbers divided by the number of numbers
2199.55 / 100 = 21.9955
Mode is the number that repeats the most in the data set. 22 repeats 12 times. It is the mode
Median is the number that is in the center of the data set. There is 2 numbers in the center of this data set. Both are 22, the median is 22.
Histogram
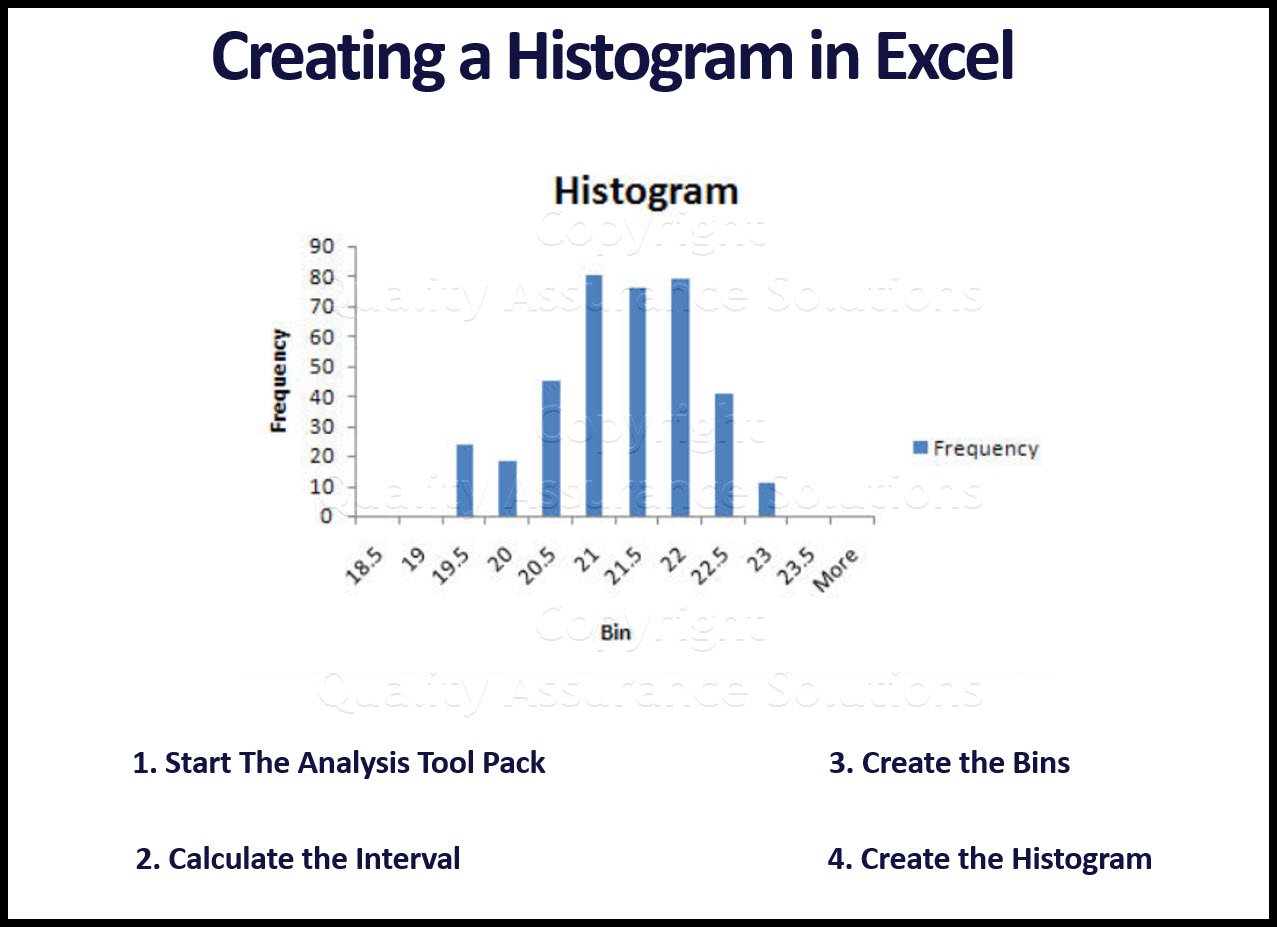
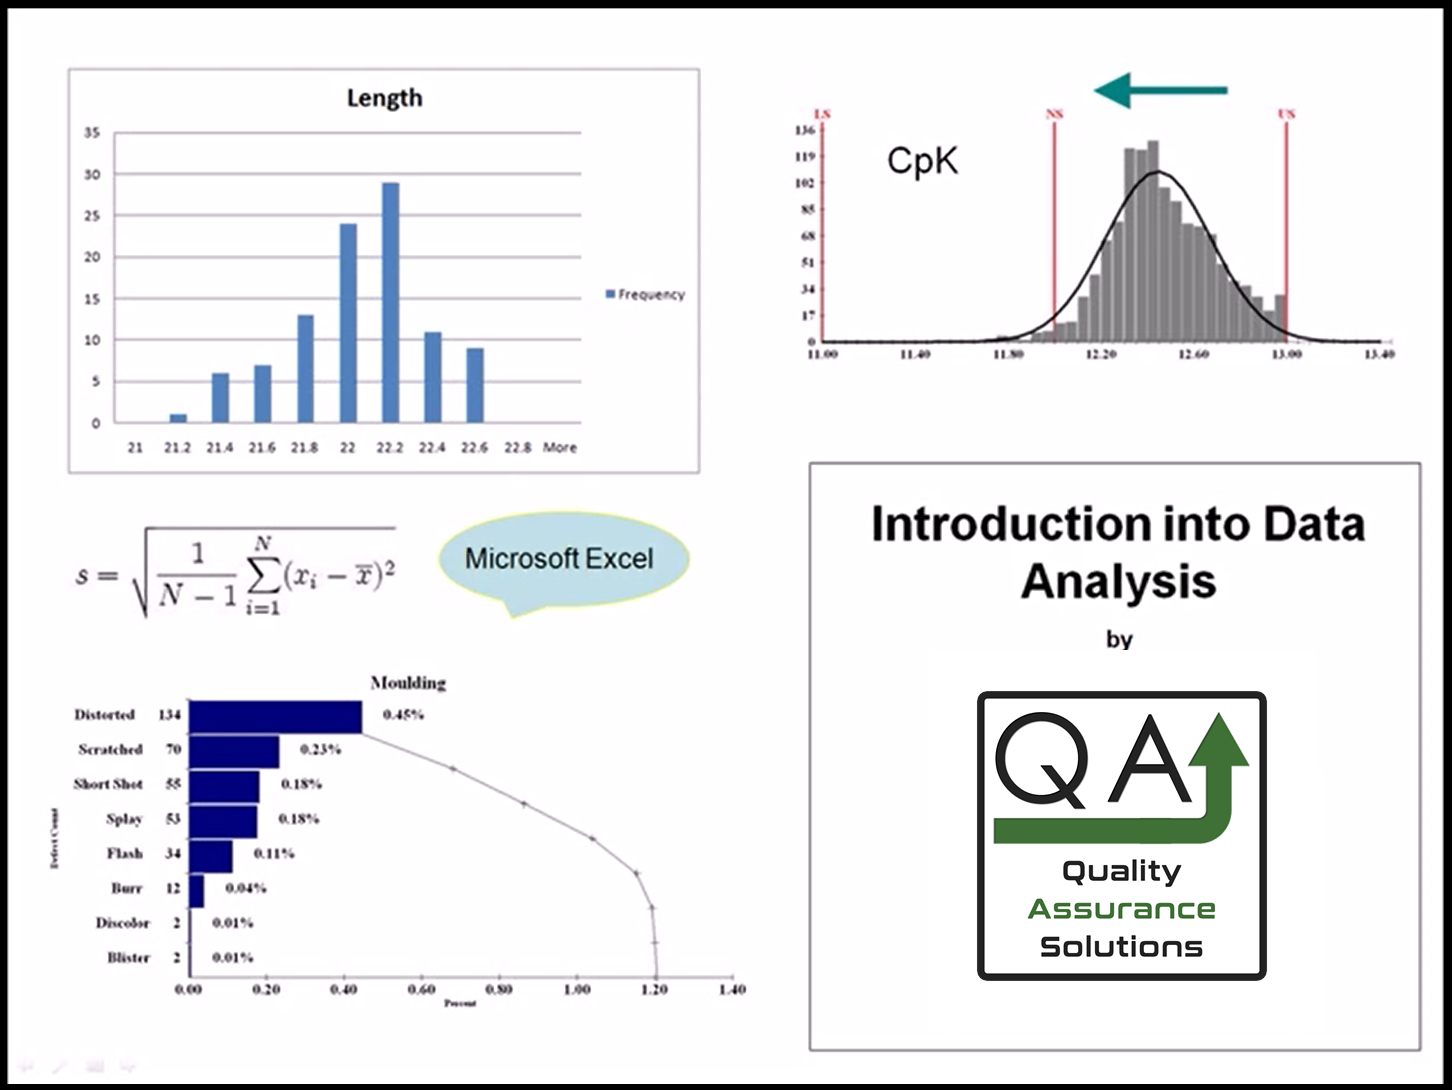
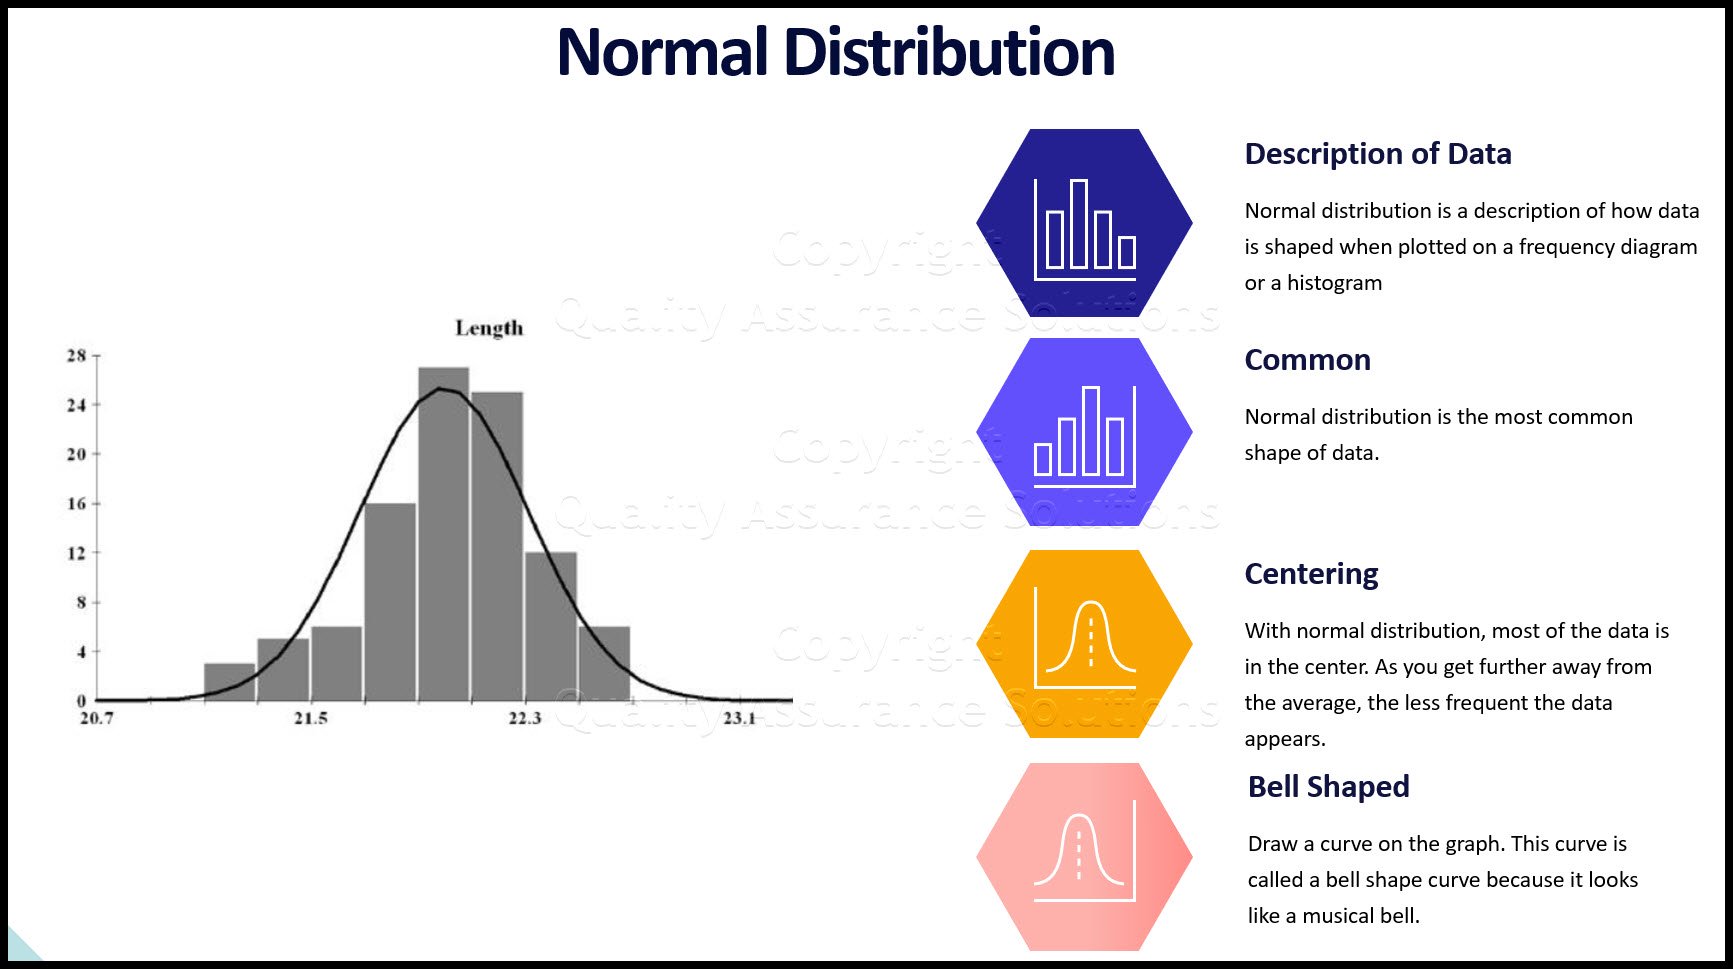
What is Data Analysis? We can take the data and make a histogram.
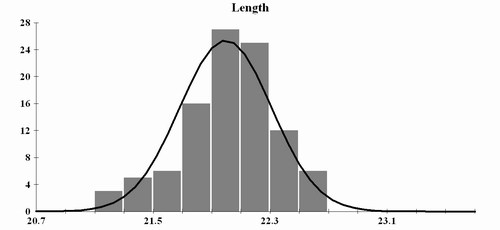
- A histogram is visual representation of the data.
- The Y axis is the frequency that the number occurs. The X axis is the measurement cells.
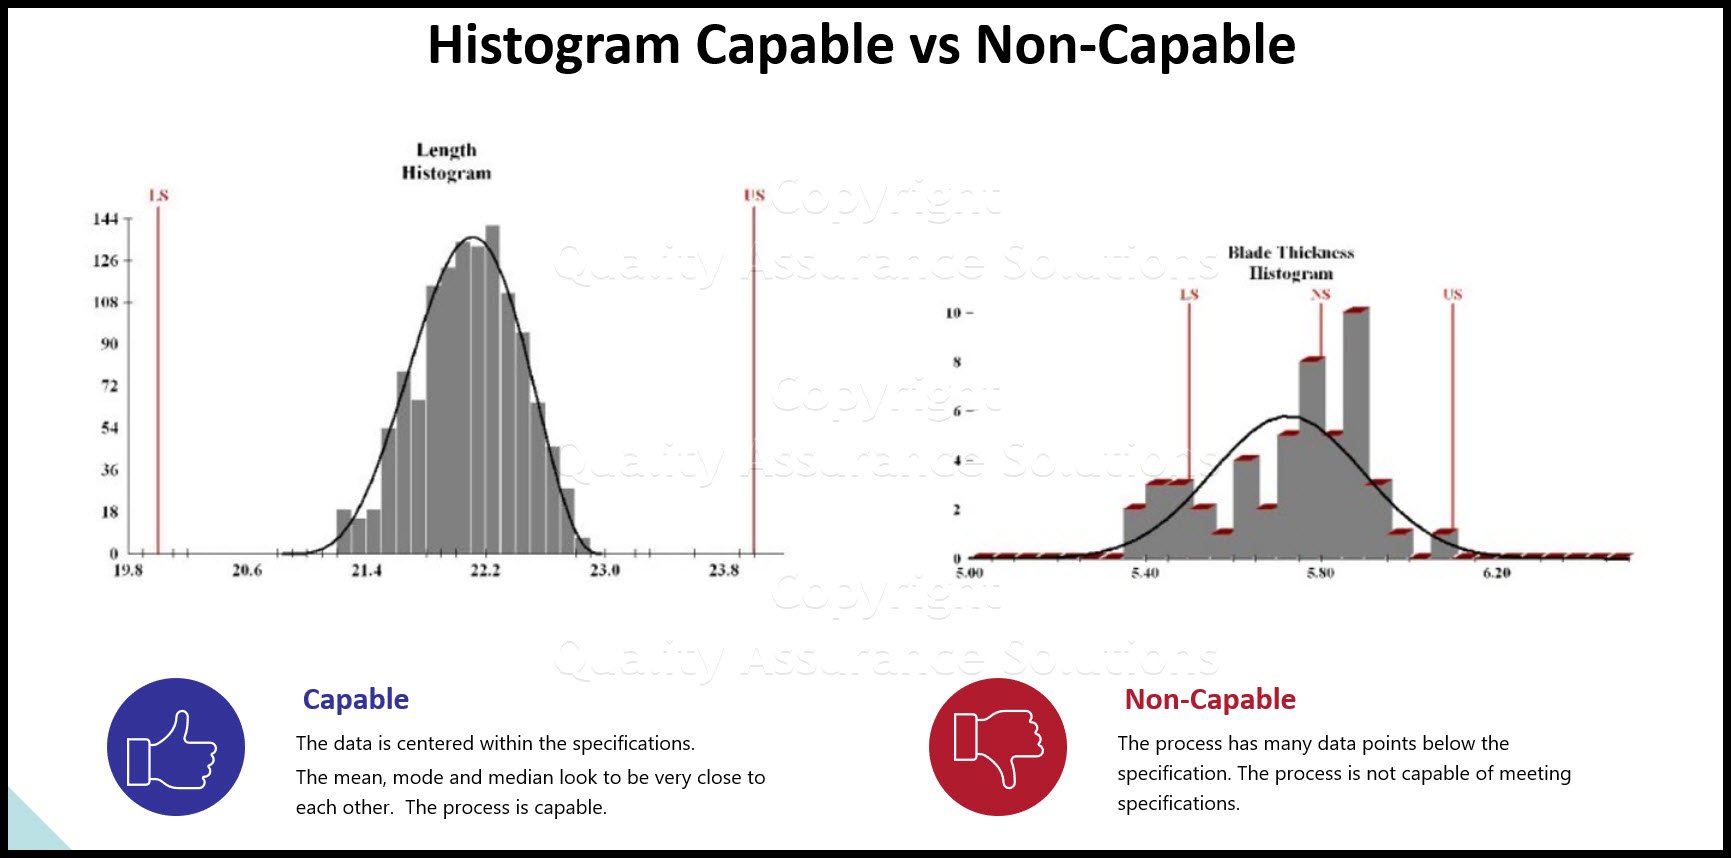
Most of the data is centered about 22.
The mean is 21.9955, The mode is 22 and the median is 22. All average data points are 22.
The data is centered about 22. The further away the measurement is away from 22, the less frequent the data appears.
What is data analysis? Data analysis include creating a picture of the data. This picture is called a frequency diagram or a histogram.
This Data Analysis Video teaches you the basic tools for understanding, summarizing, and making future predictions with your collected data. Includes MS Excel templates.
Normal Distribution
There is a curve driven on the data set. This curve is called a bell shape curve because it looks like a musical bell instrument.
When the data has a bell shape curve we call this normal distribution.
When we have normal distribution we can calculate the standard deviation of the sample. Standard deviation measures the spread of the data about the mean. It tells us the width of the bell shape curve.
You can find more on normal distribution here.
Standard Deviation
The formula for standard deviation is:

Step 1: Take each number and subtract it from the mean. Square the results. Then sum each of those.
(21.2 – 22)2 + (21.8-22)2 + (22-22)2+….
Step 2: (Step 1 total) / (100-1)
Step 3: take the square root of step 2.
For the speaker length, the standard deviation is .314
This is a difficult calculation but Microsoft excel can do it easily.
The two terms - What is data analysis?
What is data analysis? We now have 2 statistics that describes our data set. The first is the mean and the other is standard deviation. The mean tells us the center of our data. The standard deviation tells us the spread of the data.
Mean and standard deviation are the most common terms when it comes to data analysis. Understanding these two terms and normal distribution are basic tools for process improvement. This allows us to apply many other tools to making improvement.
This Data Analysis Video teaches you the basic tools for understanding, summarizing, and making future predictions with your collected data. Includes MS Excel templates.
|
Quality Assurance Solutions Robert Broughton (805) 419-3344 USA |
 |
|
Software, Videos, Manuals, On-Line Certifications | ||
|
An Organizational Task Management System. Projects, Meetings, Audits & more | ||
|
Corrective Action Software | ||
|
Plan and Track Training | ||
|
AQL Inspection Software |
|
450+ Editable Slides with support links | ||
|
Learn and Train TRIZ | ||
|
Editable Template | ||
|
Templates, Guides, QA Manual, Audit Checklists | ||
|
EMS Manual, Procedures, Forms, Examples, Audits, Videos | ||
|
On-Line Accredited Certifications Six Sigma, Risk Management, SCRUM | ||
|
Software, Videos, Manuals, On-Line Certifications |
