MSA Validity
MSA Validity Overview
Process variation affects how products and services appear to Customers. However, what you and ultimately the customer see as the product appearance does not include only the variability in the entity itself, but also some variation from the way the entity is measured. MSA Validity addresses this.
A simple example of this is to pick up a familiar object, such as a pen. If you measured the diameter of the pen and then judge the readability of the lettering on the pen. Then you handed the same pen to three other people, it is likely that there would be a difference in answers among everyone.
This Data Analysis Video teaches you the basic tools for understanding, summarizing, and making future predictions with your collected data. Includes MS Excel templates.
It is also highly likely that if someone handed you the same pen later (without you knowing it is the same pen) and asked you to measure it again, you would come to a different answer or conclusion.
The pen itself has not changed; the difference in answers is purely due to the measurement system and specifically errors within it.
The higher the measurement error, the harder to understand the true process capability and behavior. Therefore, your should analyze measurement systems before embarking on any process improvement activities.
The sole purpose of a measurement system in lean sigma is to collect the right data to answer the questions being asked. To do this, the team must be confident in the integrity of the data being collected. To confirm this data Integrity, the team must know
- The type of data
- If the available data is usable
- If the data is suitable for the project
- How the data can be audited
- If the data is trustworthy
Learn SPC in an hour. Train your employees. Improve your processes and products. Prevent defects and save your company money.
Roadmap
We cover the validity road map in this section. Reliability is dependent on the data type and is covered in MSA Attribute and MSA Continuous
Step 1. Apply a data integrity audit to the data. Does the data have the below items.
- Goal
- Target metrics
- Sampling Plan
For these, it is useful to refer to "KPOVs and Data"
The Data Integrity Audit is a short pilot run of the sampling plan with the aim of confirming the data.
Step 2. For each metric in the sampling plan, determine how the metric can be validated by a parallel method of capture.
Audits must be independent of the data collection, processing, and reporting systems This can be accomplished by any method that makes sense, but the key is that there must be a second, independent source of data to compare against the normal data system.
Data may be kept in computer databases; so it is useful to have a representative from the IT organization involved at this point in the project. There are times when portions (if not all) of the data processes are already being checked automatically for data integrity.
If there are no automated systems involved, then a second manual, parallel data capture is required.
For each metric in the sampling plan, the team must agree on acceptance requirements for the metric
A complete list of criteria should be agreed upon before the conducting the so the expectations are clear.
8D Manager Software with 8D, 9D, 5Y and 4M report generator. Your corrective action software for managing, measuring, and reporting issues.
Step 3. For the data collection, consider the validity of the data as follows:
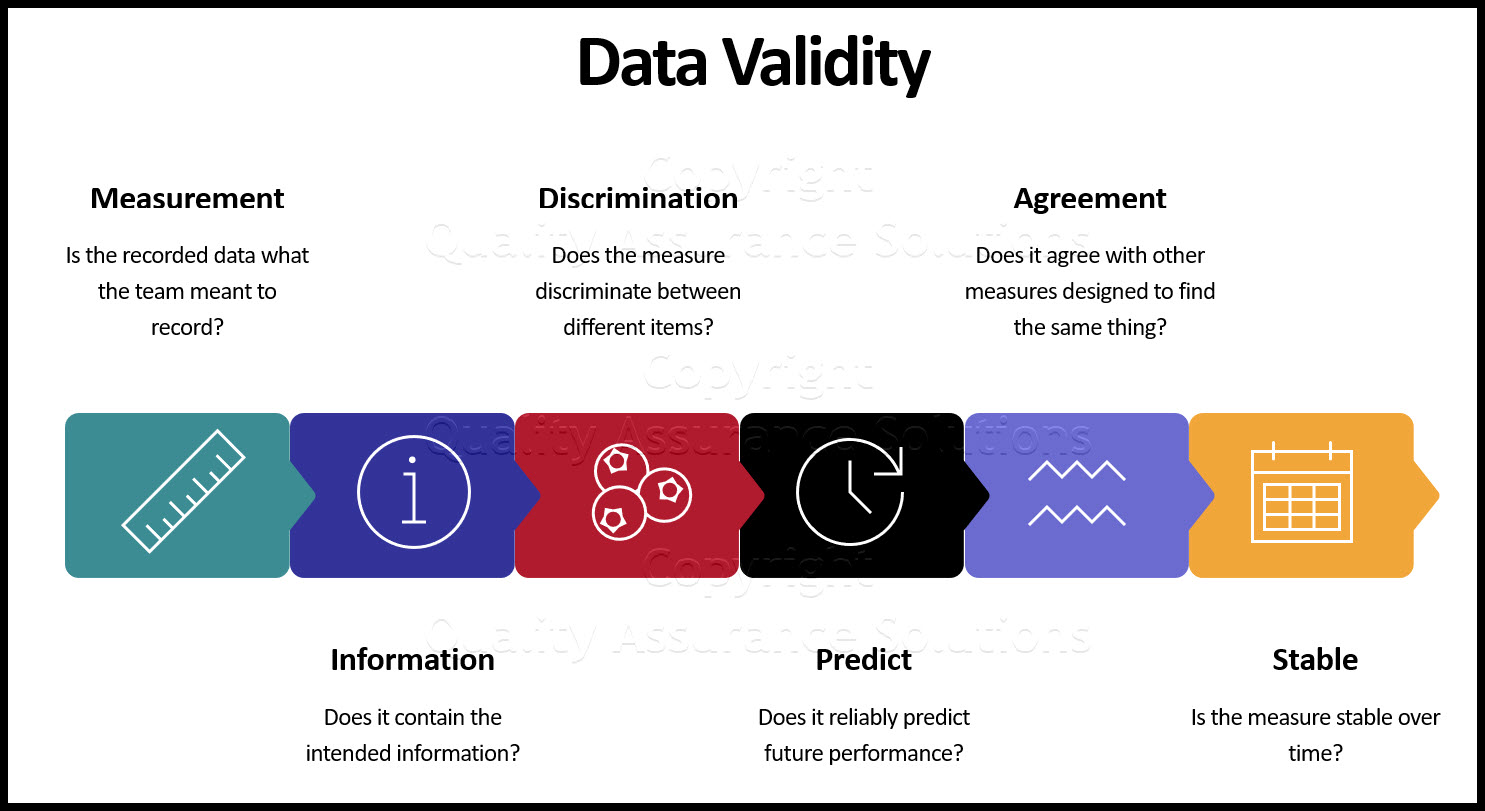
- Is the recorded data what the team meant to record? It is useful to refer back to the Operational Definition of the metric at this point
- Does it contain the intended information?
- Does the measure discriminate between different items?
- Does it reliably predict future performance?
- Does it agree with other measures designed to find the same thing?
- Is the measure stable over time?
If you find the captured points invalid then stop the data collection. The temptation during such an audit is to give it a go and see what happens and then regroup, make tweaks, and redo the audit. It is always best to try to do the audit right the first time.
Performing a thorough data method validation can be a tedious process, but the quality of generated data from the sampling plan directly links to the success of the project.
Step 4. Based on the audit results in Step 3, take any actions required to mend the sampling plan or data capture mechanism.
The consequences of invalid data validation methods always vastly exceed what would have been expended initially if the validation studies had been performed properly.
Step 5. Rerun what is effectively a confirmatory Audit.
|
Quality Assurance Solutions Robert Broughton (805) 419-3344 USA |
 |
|
Software, Videos, Manuals, On-Line Certifications | ||
|
450+ Editable Slides with support links | ||
|
Corrective Action Software | ||
|
Plan and Track Training | ||
|
AQL Inspection Software |
|
Learn and Train TRIZ | ||
|
Editable Template | ||
|
Templates, Guides, QA Manual, Audit Checklists | ||
|
EMS Manual, Procedures, Forms, Examples, Audits, Videos | ||
|
On-Line Accredited Certifications Six Sigma, Risk Management, SCRUM | ||
|
Software, Videos, Manuals, On-Line Certifications |


