Visual Walkthrough
for
Internet Marketing
Here we discuss why a visual walkthrough is important for internet marketing.
As a whole, people tend to be drawn to things that are visually stimulating. The internet is no exception.
Have you ever been to a website and not been able to concentrate on the offered information because the design is either terrible or overdone? The look of a website, email, or internet ad is critical when it comes to gaining and keeping the interest of viewers.
Quite a few internet trends, popular websites and social networks focus on the use of images. Many people use Facebook to share personal photos. Companies also use the social networking site to share pictures of products, services, and even customers who are buying or using a product. Instagram is also a very popular photo-sharing site that both individuals and businesses are using to share photos. The most popular of the visually-focused websites is Pinterest. Businesses should definitely implement Pinterest in their social strategies.
TrainingKeeper Software. Keep, organize and plan all your employees' training and activities. Software includes multi-user support with reports, certs, and calendars.
Pinterest Visual Walkthrough
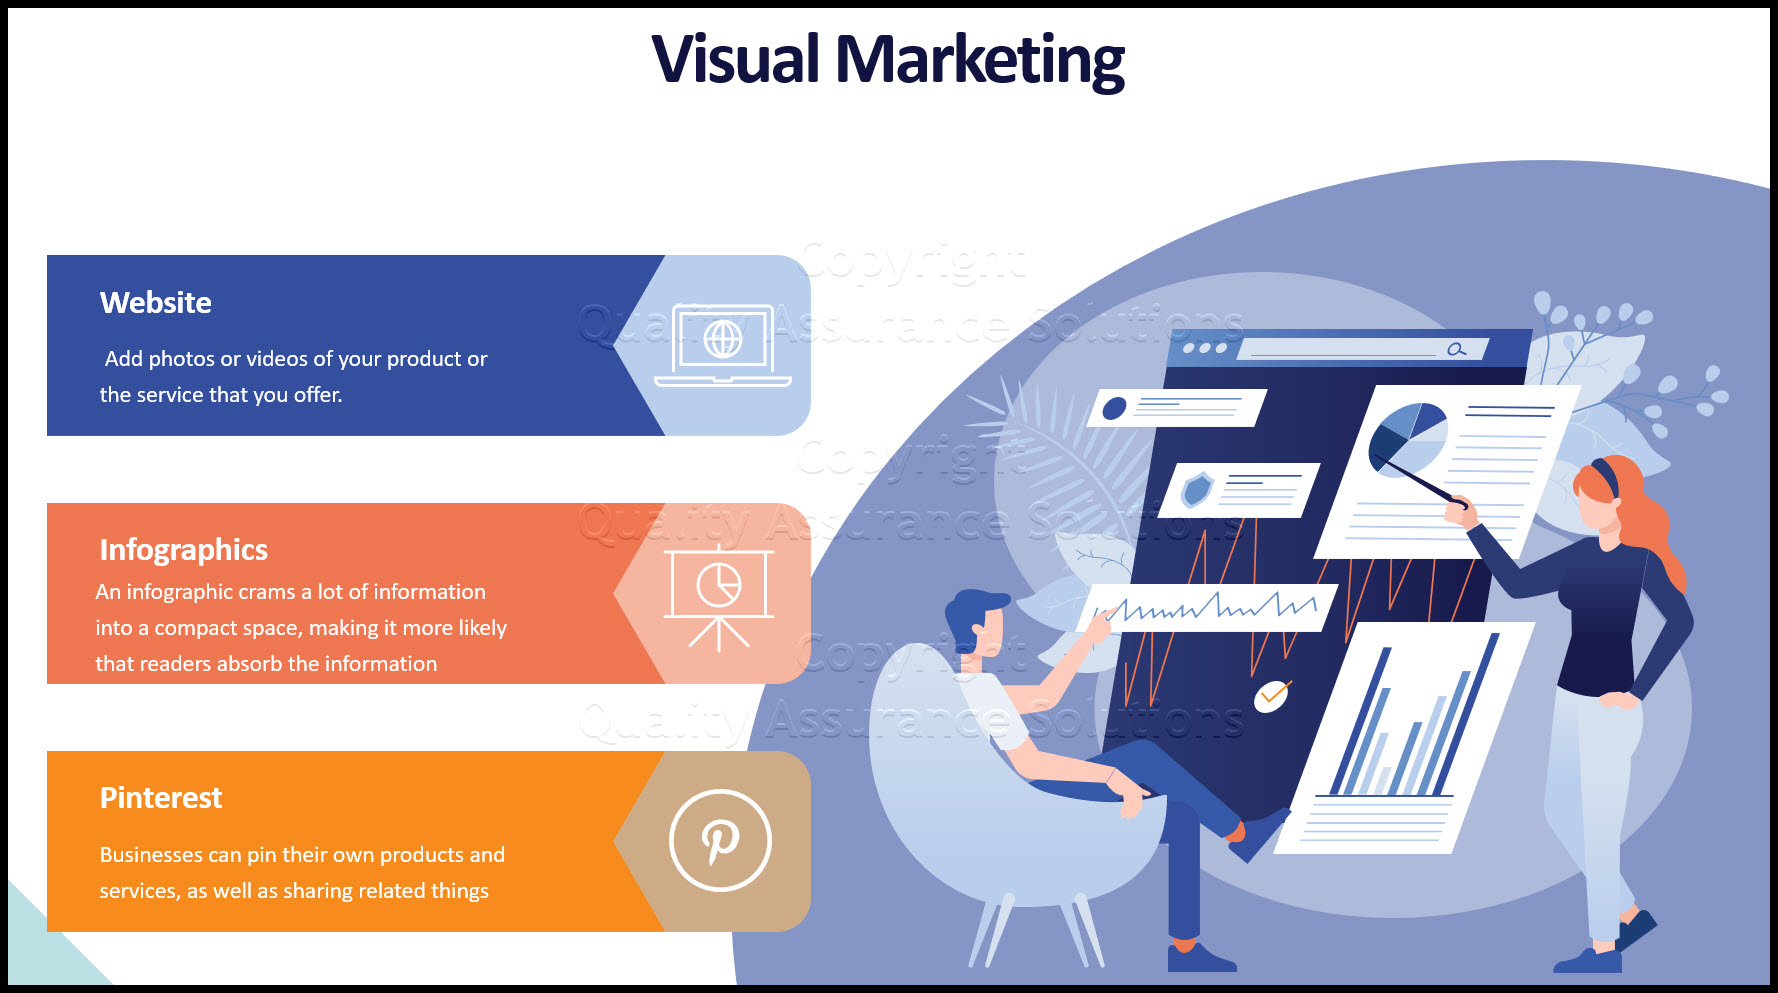
Pinterest exploded onto the social network scene. It gained popularity with individuals very quickly, and now businesses have caught on as well. Businesses can pin their own products and services, as well as sharing related things. Pinterest with a very simple site design, does not take away from the pins that their users choose.
A recent survey by Steelhouse shows that as many as 59% of Pinterest users have purchased an item that they saw on Pinterest. This compares to only 33% of Facebook users who have purchased something they saw on Facebook. To me, this shows that a visually stimulating website can absolutely help to drive sales.
Infographics
Another trend in online marketing and advertising is the infographic. Infographics are visually interesting graphics that depict information about any number of subjects. Companies use them to convey information in a new and exciting way, rather than having people just read a large block of text. An infographic crams a lot of information into a compact space, making it more likely that readers absorb the information. Infographics should be creative and colorful.
This Data Analysis Video teaches you the basic tools for understanding, summarizing, and making future predictions with your collected data. Includes MS Excel templates.
Website
Having a visually interesting website is probably the best thing that you can do for your business. However, a fine line exists between a well-designed website and one that takes it over the top. Be cautious with your color and pattern choices. Be sure to add photos or videos of your product or the service that you offer. Personally, I am much less likely to purchase a product that I can’t see first. And with a huge shift towards online shopping, images are more important than ever.
Using interesting and relevant visuals to enhance your online presence is becoming more and more important. Consider adding visual walkthrough interest to your website, social media pages, and marketing materials. You may see a significant uptick in sales!
Article written by Megan Totka, Chief Editor for ChamberofCommerce.com. Article edited and posted by Quality Assurance Solutions
|
Quality Assurance Solutions Robert Broughton (805) 419-3344 USA |
 |
|
Software, Videos, Manuals, On-Line Certifications | ||
|
450+ Editable Slides with support links | ||
|
Corrective Action Software | ||
|
Plan and Track Training | ||
|
AQL Inspection Software |
|
Learn and Train TRIZ | ||
|
Editable Template | ||
|
Templates, Guides, QA Manual, Audit Checklists | ||
|
EMS Manual, Procedures, Forms, Examples, Audits, Videos | ||
|
On-Line Accredited Certifications Six Sigma, Risk Management, SCRUM | ||
|
Software, Videos, Manuals, On-Line Certifications |


