Auditing SPC Inspection
First, do you maintain a SPC inspection (Statistical Process Control) program? If not, you can extensively improve your processes and products by establishing a SPC program. SPC is a visual and scientific tool used for controlling and improving your processes.
This article discusses key questions and expected answers when auditing the SPC program. This article focuses on auditing the SPC system and auditing the individual charts.
Consider these four elements when auditing the SPC program
1) Documentation
2) Training
3) Reviewing the Charts
4) Process Improvement
Learn SPC in an hour. Train your employees. Improve your processes and products. Prevent defects and save your company money.
SPC Inspection Documentation
Does the company keep a top level document that covers the process for selecting the key characteristics for SPC monitoring?
The document should cover...
- Reasons for selecting a given measurement.
- Who approves the selection of the SPC inspection charts
- The reasoning behind selection of sample size and sampling frequency
- The method of applying SPC. Does the company use a computerized system and a particular type of software? Or are the charts hand drawn?
- General reaction guidelines for out of control conditions
- The methods of data review
- The need for other individual procedures for each measurement
This general document specifies the scope of the SPC system.
Does the company keep an overarching log that shows the SPC inspection points?
This could be a quality control plan or another controlled document. It should show the department, process or product, the SPC inspection name, the frequency and sample size. It may have other information such as the OCAP(Out of Control Action Plan), process champion and measurement instrument.
How do you select which characteristics are being monitored with SPC?
The process champion, engineering, QA or someone responsible for process control should select the critical measurements. The characteristic should be critical to the success of the process or product. The need for SPC can come from product development, quality plan, six sigma projects, corrective actions or preventive actions.
Is there a documented process for monitoring the SPC system?
SPC relies heavily on monitoring the charts. Someone needs to be responsible for examining the charts and reacting to the charts. The system should have an established OCAP (Out of Control Action Plan) for each type of measurement. Individual procedures may be necessary for each measurement for the OCAP. Depending on the situation, a global OCAP could be used.
Can the company provide a documented procedure for the specific SPC inspection?
Assure a procedure exists for each measurement under SPC inspection control. Similar to AQL inspection these procedures need to cover
- The specific measurement
- The frequency of measurement
- The sample size
- The method of measurement
- The type of measurement tool
- The person responsible for measurement
- The out of control plan
- The applicable control rules for the measurement.
Does the documented Out of Control Plan (OCAP) specify the steps to resolve out of control issues?
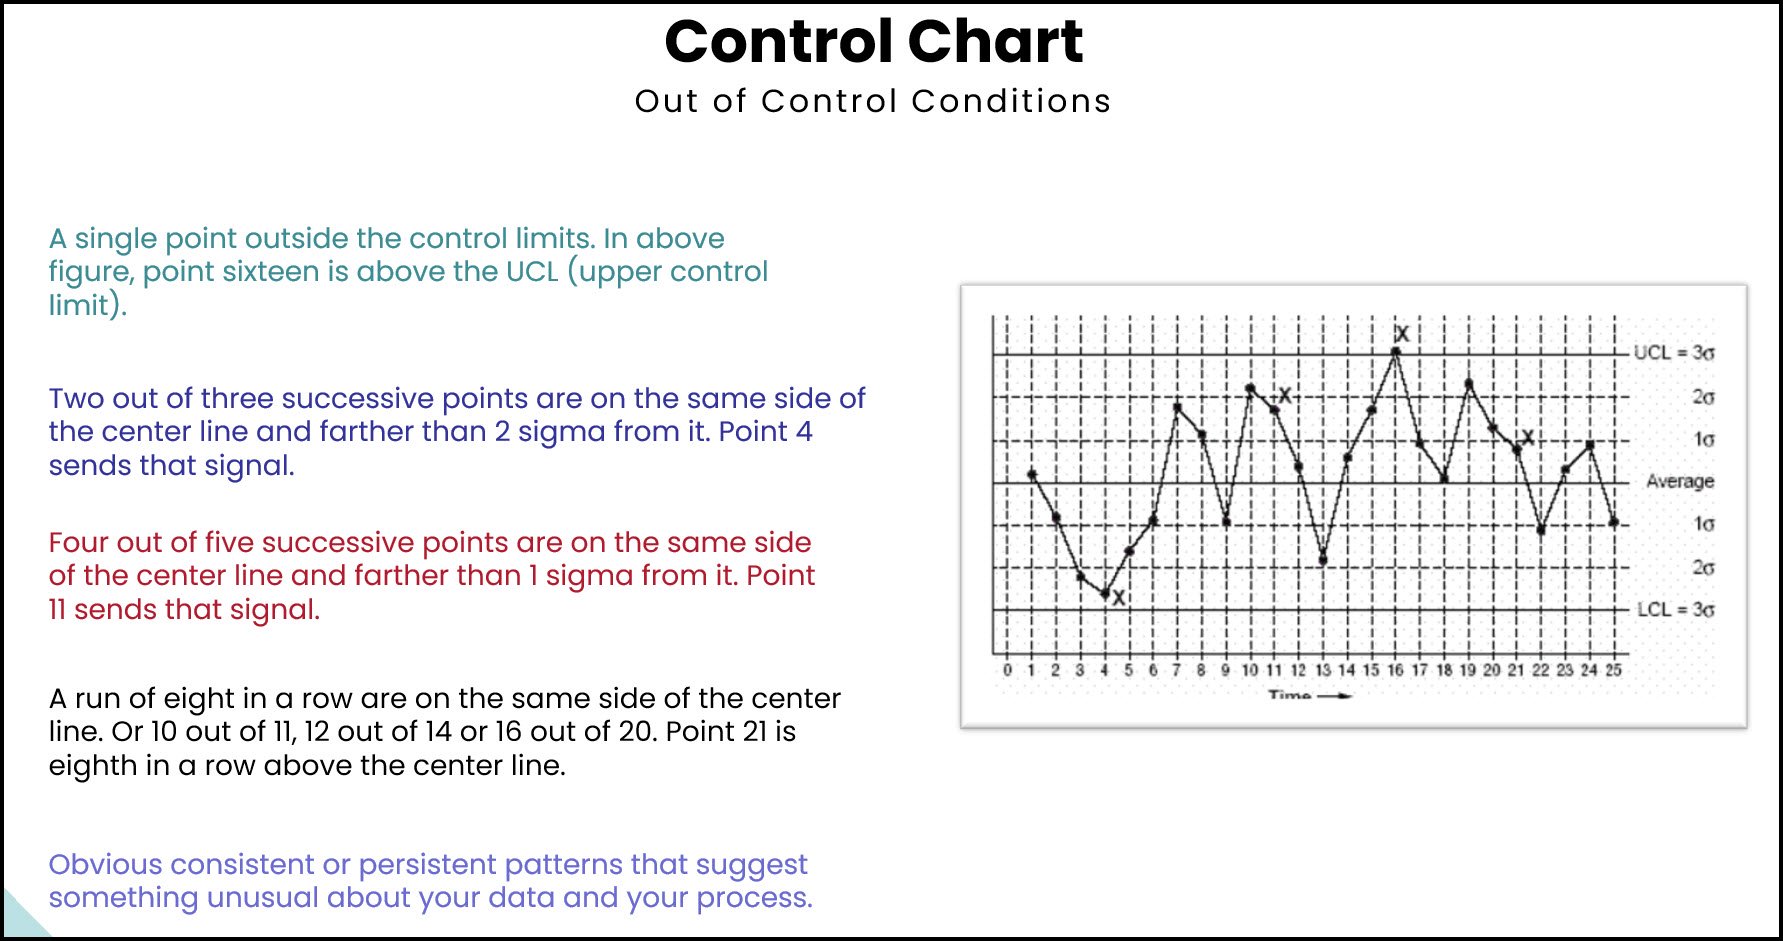
The OCAP specifies which SPC rules apply. In most cases, we consider a process to be out of control when the data point charts above or below the control limits. Other rules could apply such as zone, trend and run rules. Did the OCAP consider these rules?
The OCAP documents the specific steps to bring the process back into control. If the process cannot be brought into control after executing the specific steps, then does the OCAP detail the next course of action? The OCAP's last option should be the notification of the process champion.
Learn SPC in an hour. Train your employees. Improve your processes and products. Prevent defects and save your company money.
Training
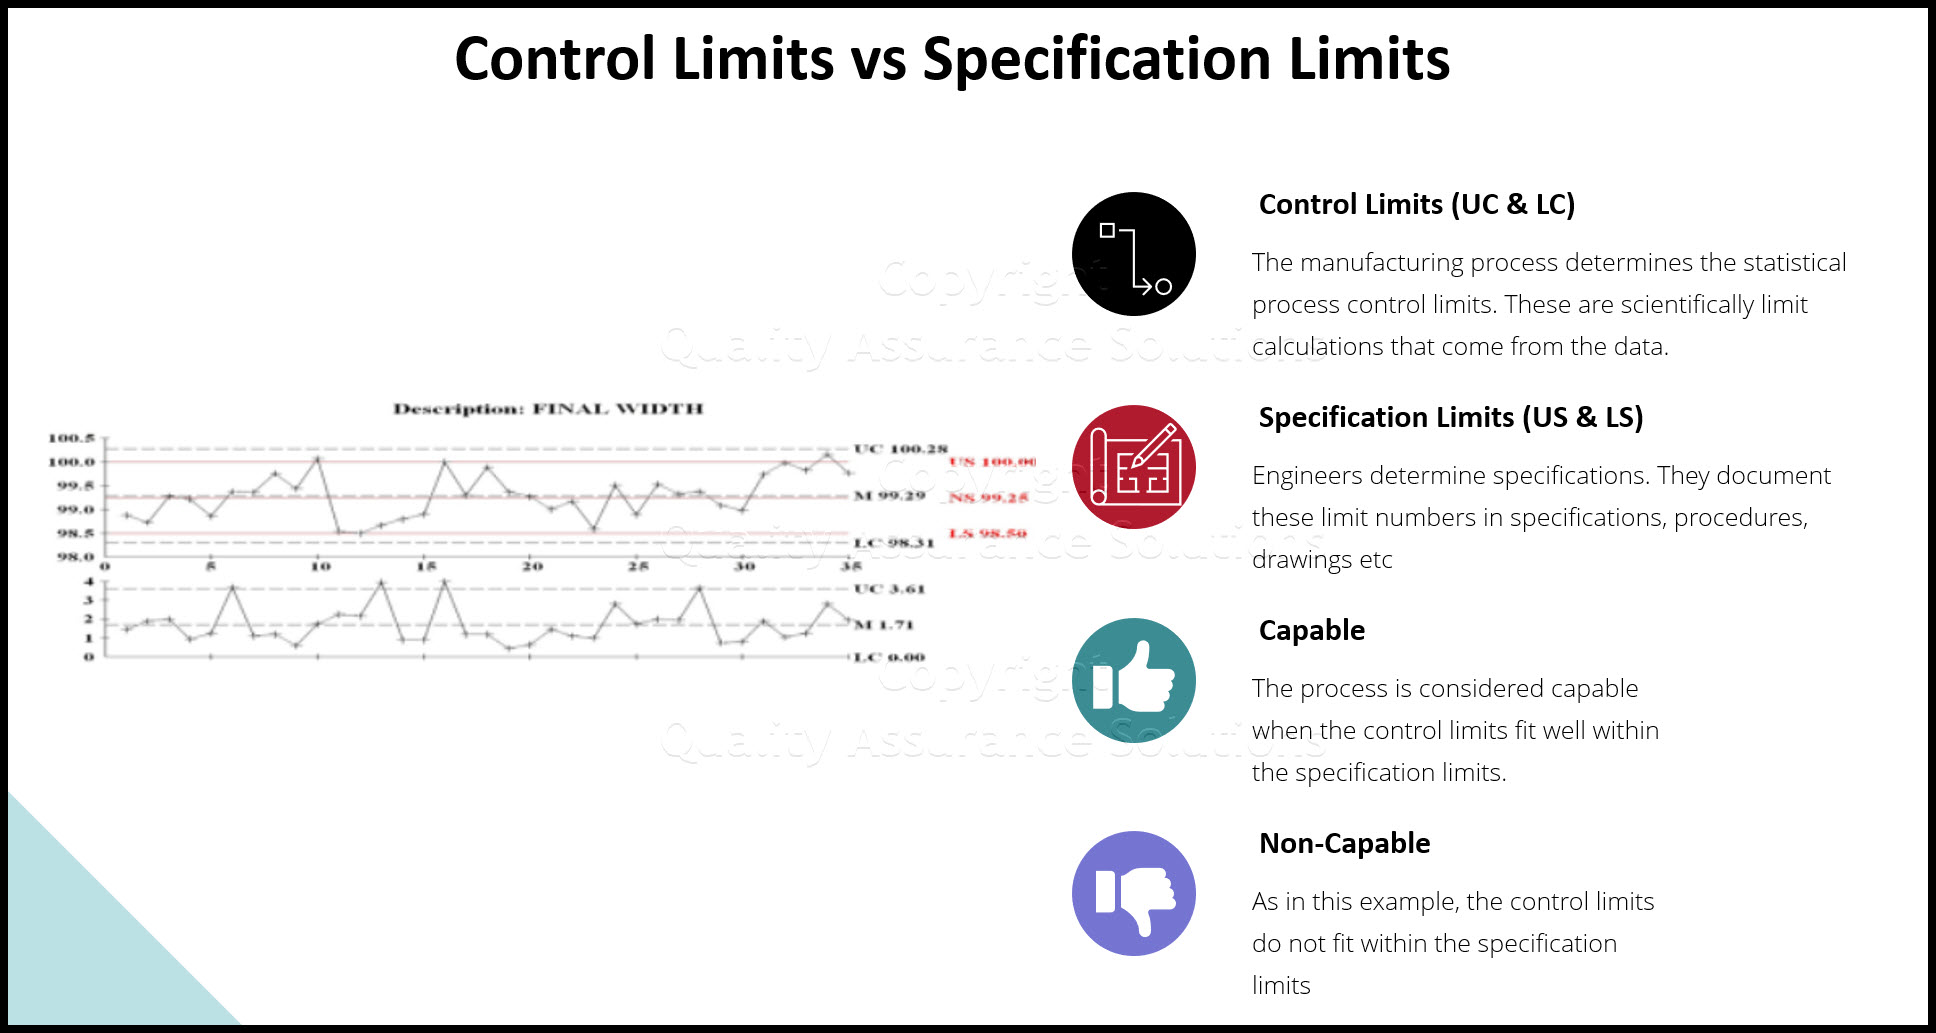
Interview the process champion. Do they understand the difference between SPC control limits and engineering specification limits?
The process champion must understand that the the process, statistics and normal distribution determines the control limits. Engineering, customer or some other outside source creates the specification limits. In many cases users inaccurately applied specification limits for control instead of the natural control limits.
When deciding on the control limits, can the process champion describe the reasoning behind dynamic limits or static limits?
One uses static control limits for a stable process with no on-going improvements on the process. Static control limits catch process shifts. On the other hand, dynamic control limits change with the last reading. One uses dynamic limits for new or improved processes.
Did the company complete a statistical study prior to implementing the SPC inspection chart?
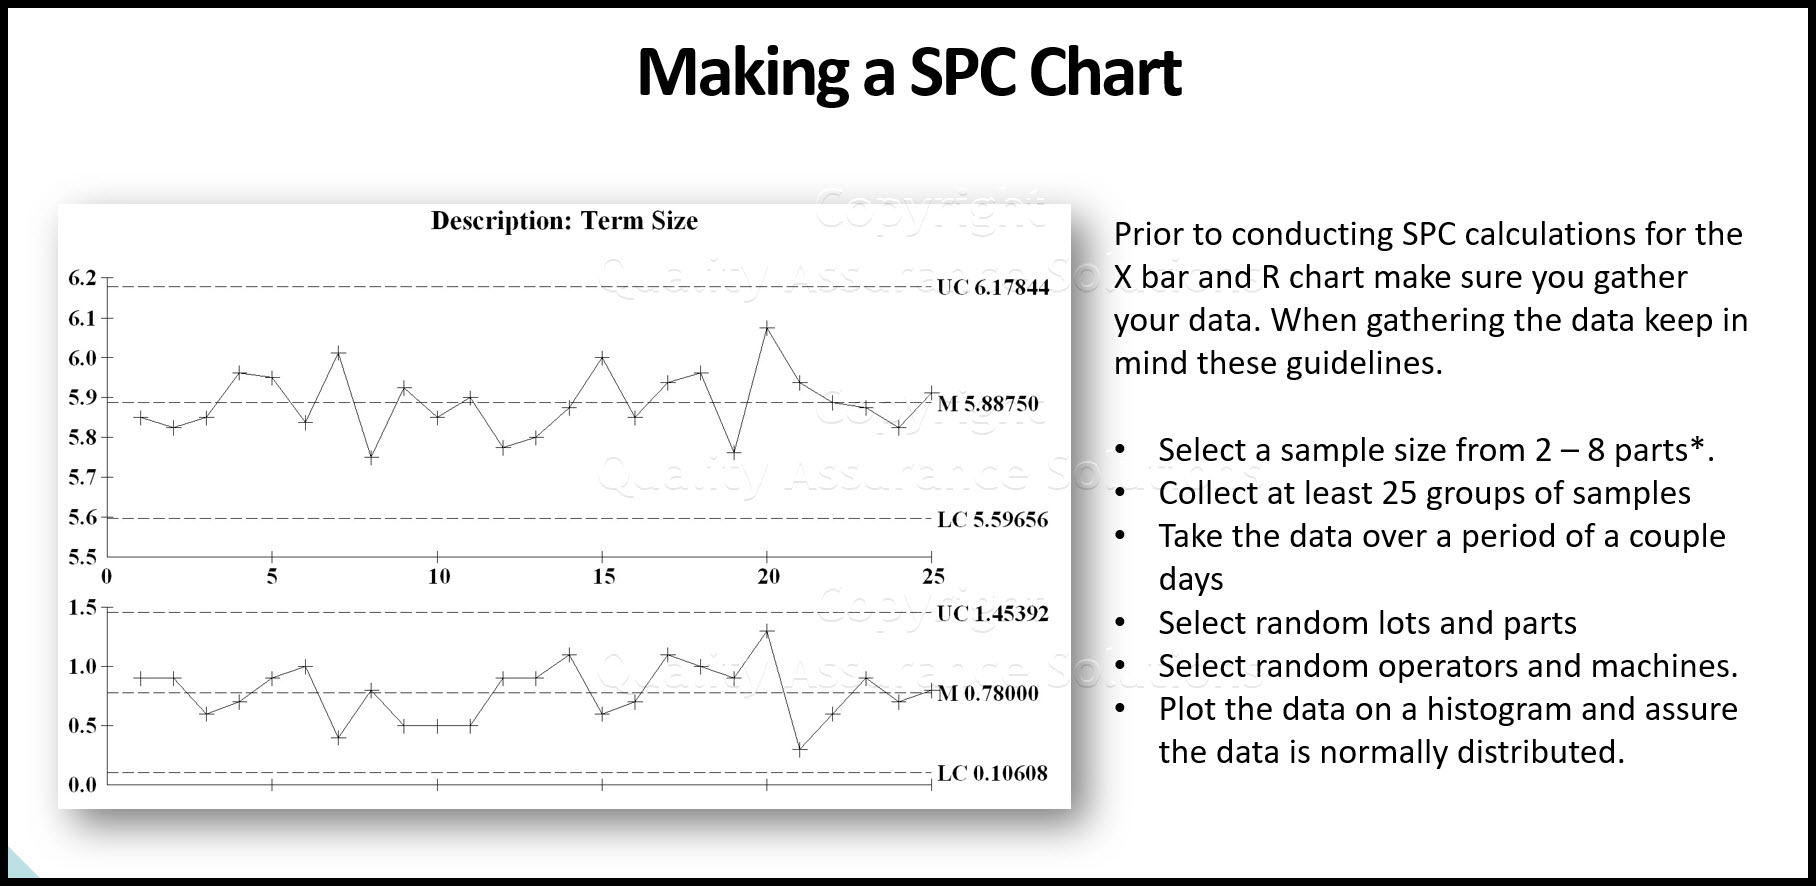
For variable data, the common X bar and R chart is based on normal distribution. The process owner should prove with a histogram that the data showed normal distribution prior to implementing the chart.
Quiz the person collecting and charting the data.
Do they understand the charts? Do they know when an out of control condition applies? What do they do when they encounter an out of control condition? Are they following the OCAP? Are they following the documented procedure for the collecting the data?
Review the training records for the person collecting and charting the data.
There should be at least 2 records. The first training record should cover SPC training. The second training record should cover the documented procedure for the SPC inspection. Other SPC training records could include OCAP and measuring instrument usage.
Learn SPC in an hour. Train your employees. Improve your processes and products. Prevent defects and save your company money.
Reviewing the Charts
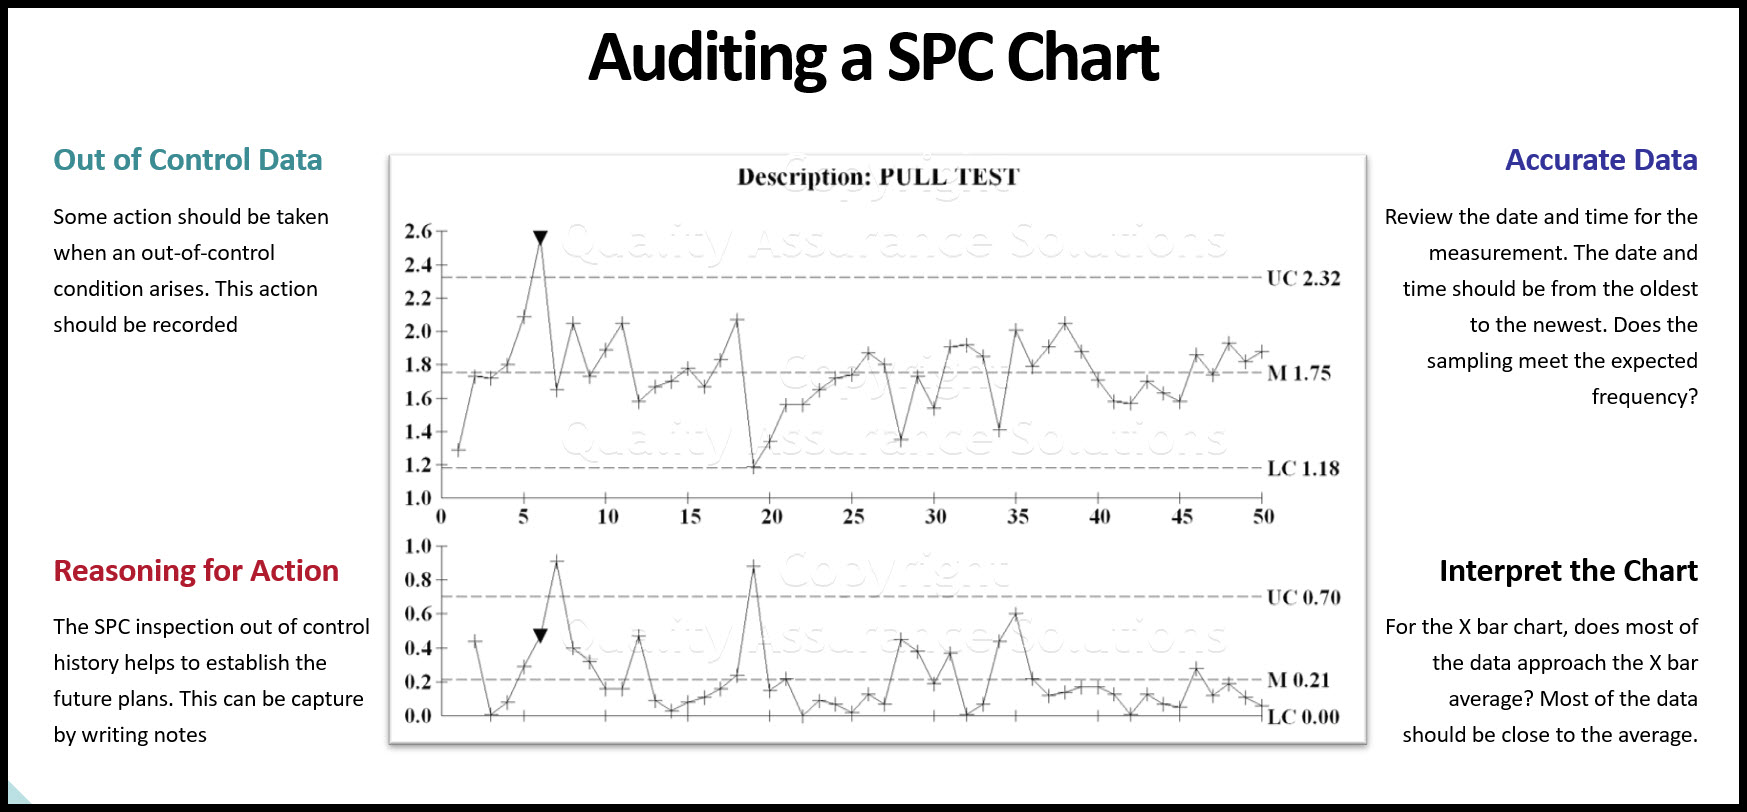
Review the control chart for out of control data. Is action taken to correct the process?
Some action should be taken when an out of control condition arises. This action should be recorded. If no one took action or conducted a review then the charts are not properly being used.
When a process goes out of control did someone record the reasoning behind the out of control state?
The SPC inspection out of control history helps to establish the OCAP. This can be capture by writing notes on the chart or having a log book for each chart. By creating a Pareto chart from the notes, the company can create a sound OCAP.
Review the control chart for accurate data collection.
Look for these items:
Review the date and time for the measurement. The date and time should be from the oldest to the newest. Does the sampling meet the expected frequency? For example, if the frequency is once an hour, check to see if measurements occur every process hour. If your find missing gaps in the time line, can the auditee explain the missing data?
Review the measurement data recorded on the chart. Does the sample size remain the same for each measurement? Sample size should not change. Are the variable numbers different within a given sample? The numbers should not be the same with in the sample. Does the user calculate the average and range correctly? Did the inspector plot the data correctly?
Does the company record the proper traceabilities. Ask the auditee to explain the traceabilities. Do they make sense to the process? Are the important traceabilities being captured such as lot number, machine number, and operator? Changes in the traceabilities may cause out of control actions.
Review the actual charting of the data:
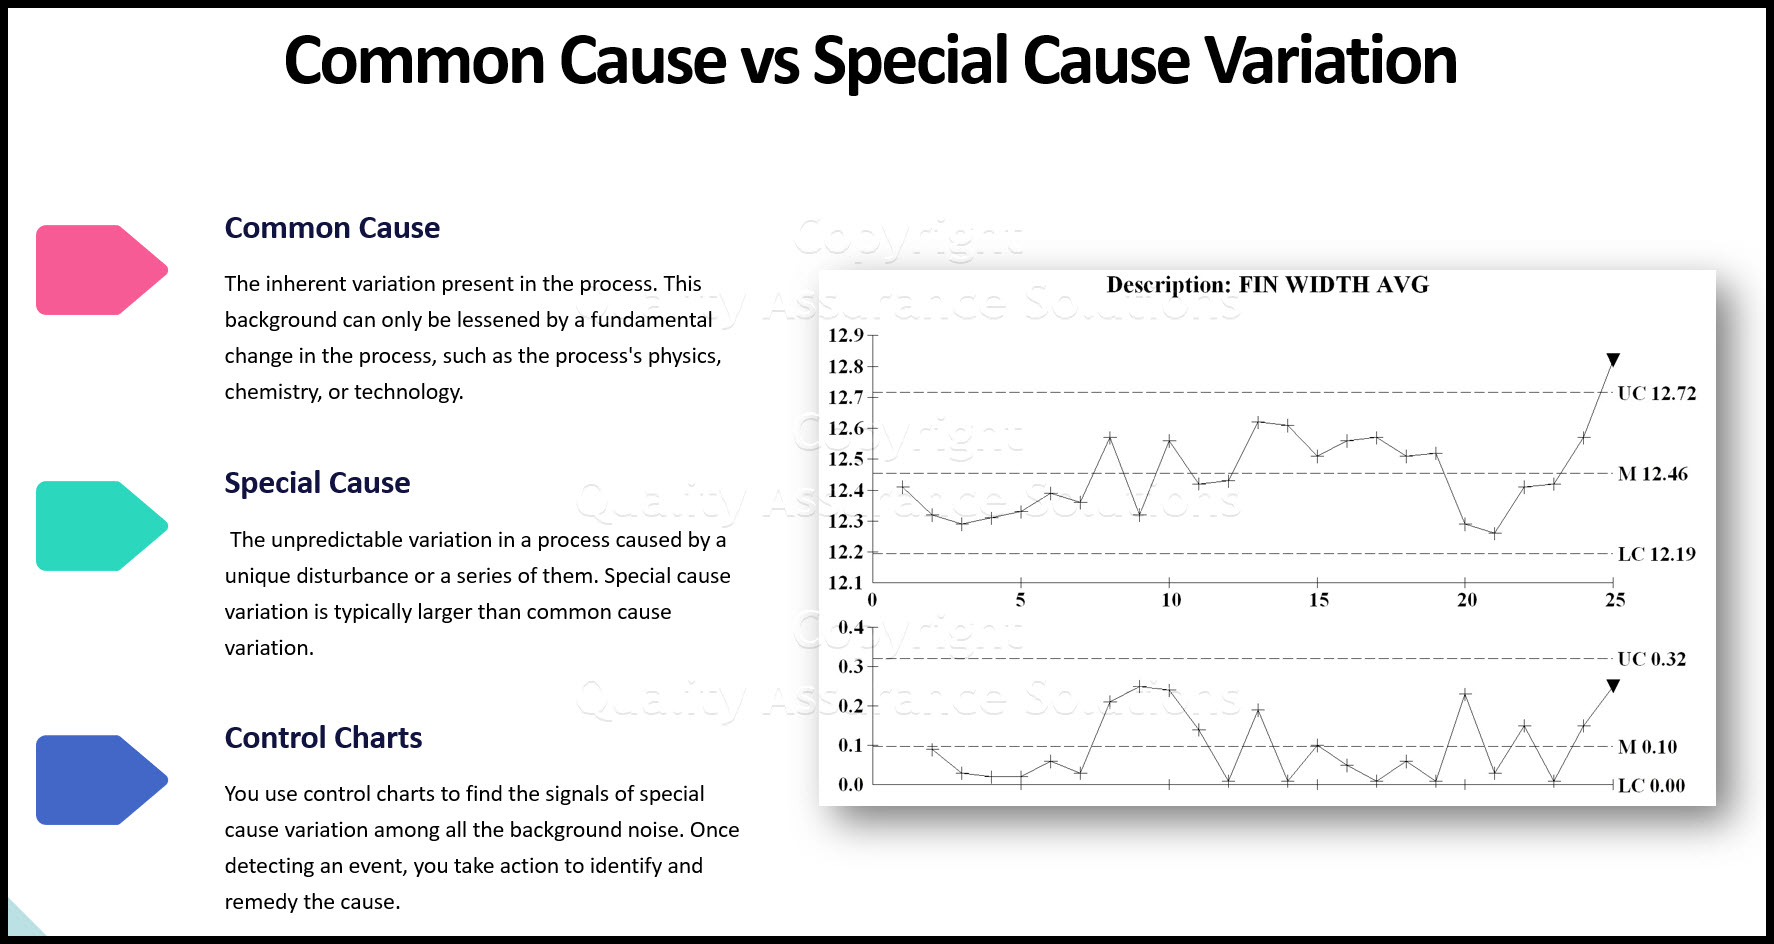
For the X bar chart, does most of the data approach the X bar average? Most of the data should be close to the average. If the data mostly runs closer to the control limits then they used the wrong type of control chart or measurement system. In these cases a CUSUM, moving range or moving average chart may be more appropriate.
Do you see repeated patterns for the X bar chart? The auditor should not expect this type of phenomena. The plotted data should be random. If there is a pattern then again, they applied the wrong type of control chart.
Review the data for trends and runs. The SPC inspection chart shows a run if you see 7 out of 8 points above or below the average. Find out if this is important to the process champion. If not, then there must be a reasonable explanation for the non importance. This also holds true for zone and trend rules.
Learn SPC in an hour. Train your employees. Improve your processes and products. Prevent defects and save your company money.
Improvement
Review the control chart history.
Review the current data; compare it to data from last month or last year or over a period of years. If the company applies SPC inspection correctly then the control limits should become tighter over time. This means the company learns from the SPC charts, eliminates assignable variation, and correctly applies the OCAP.
You would not expect to see the control limits widening. Have the process champion explain the limits widening.
Is the company applying advance statistics to the control charts?
If the company adequately collects the traceabilities with the measurements then the company can use AVOVA analysis to find if certain traceabilities create special cause variation. When finding the special cause variation, eliminate these and then the control limits tighten. Standard deviation decreases and CpK increases.
In addition the company can create control charts based on changes to one traceability and compare these to each other. For example, create a control chart for each operator. Do the control limits tighten or shift fom one operator to another? Understanding the variation due to traceabilities is important and critical to process improvement.
Summary
The more a company uses SPC, the more valuable that tool becomes to the company. When used properly SPC teaches the company about its variation. Auditing the SPC program improves the SPC program. Finding issues with the SPC program, taking action to resolve those issues strengthens the SPC program. The sounder and more reliable the SPC program, the more the company benefits from the SPC.
|
Quality Assurance Solutions Robert Broughton (805) 419-3344 USA |
 |
|
Software, Videos, Manuals, On-Line Certifications | ||
|
An Organizational Task Management System. Projects, Meetings, Audits & more | ||
|
Corrective Action Software | ||
|
Plan and Track Training | ||
|
AQL Inspection Software |
|
450+ Editable Slides with support links | ||
|
Learn and Train TRIZ | ||
|
Editable Template | ||
|
Templates, Guides, QA Manual, Audit Checklists | ||
|
EMS Manual, Procedures, Forms, Examples, Audits, Videos | ||
|
On-Line Accredited Certifications Six Sigma, Risk Management, SCRUM | ||
|
Software, Videos, Manuals, On-Line Certifications |
