Control Chart SPC
You can use control chart SPC to determine whether your process is capable or not capable. Capability means your process performs well within specifications. With SPC you compare your control chart limits to your specification limits. You then plot both sets of limits on the same chart. SPC software can automatically do this for you.
Control Limits vs Specification Limits
Engineers determine specifications. They document these limit numbers in specifications, procedures, drawings etc. Humans create specifications. In many cases, people create these specifications without process knowledge.
The manufacturing process determines the statistical process control limits. These are scientifically limit calculations that come from the data. 99.7% of collected data should fall within these statistical limits.
Specifications differ from control limits. Humans create the specification limits. Manufacturing processes creates the control limits.
Learn SPC in an hour. Train your employees. Improve your processes and products. Prevent defects and save your company money.
Control Chart SPC limits and Graphs
By graphing the process data, the control limits, the specification limits on a control charts, one can quickly tell if the process is capable of meeting the specification.

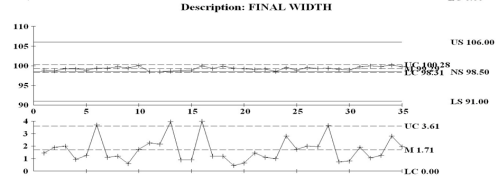
In the graph above you see the control limits (UC and LC)are well within the specification limits (US and LS). The process is capable of meeting the specification.

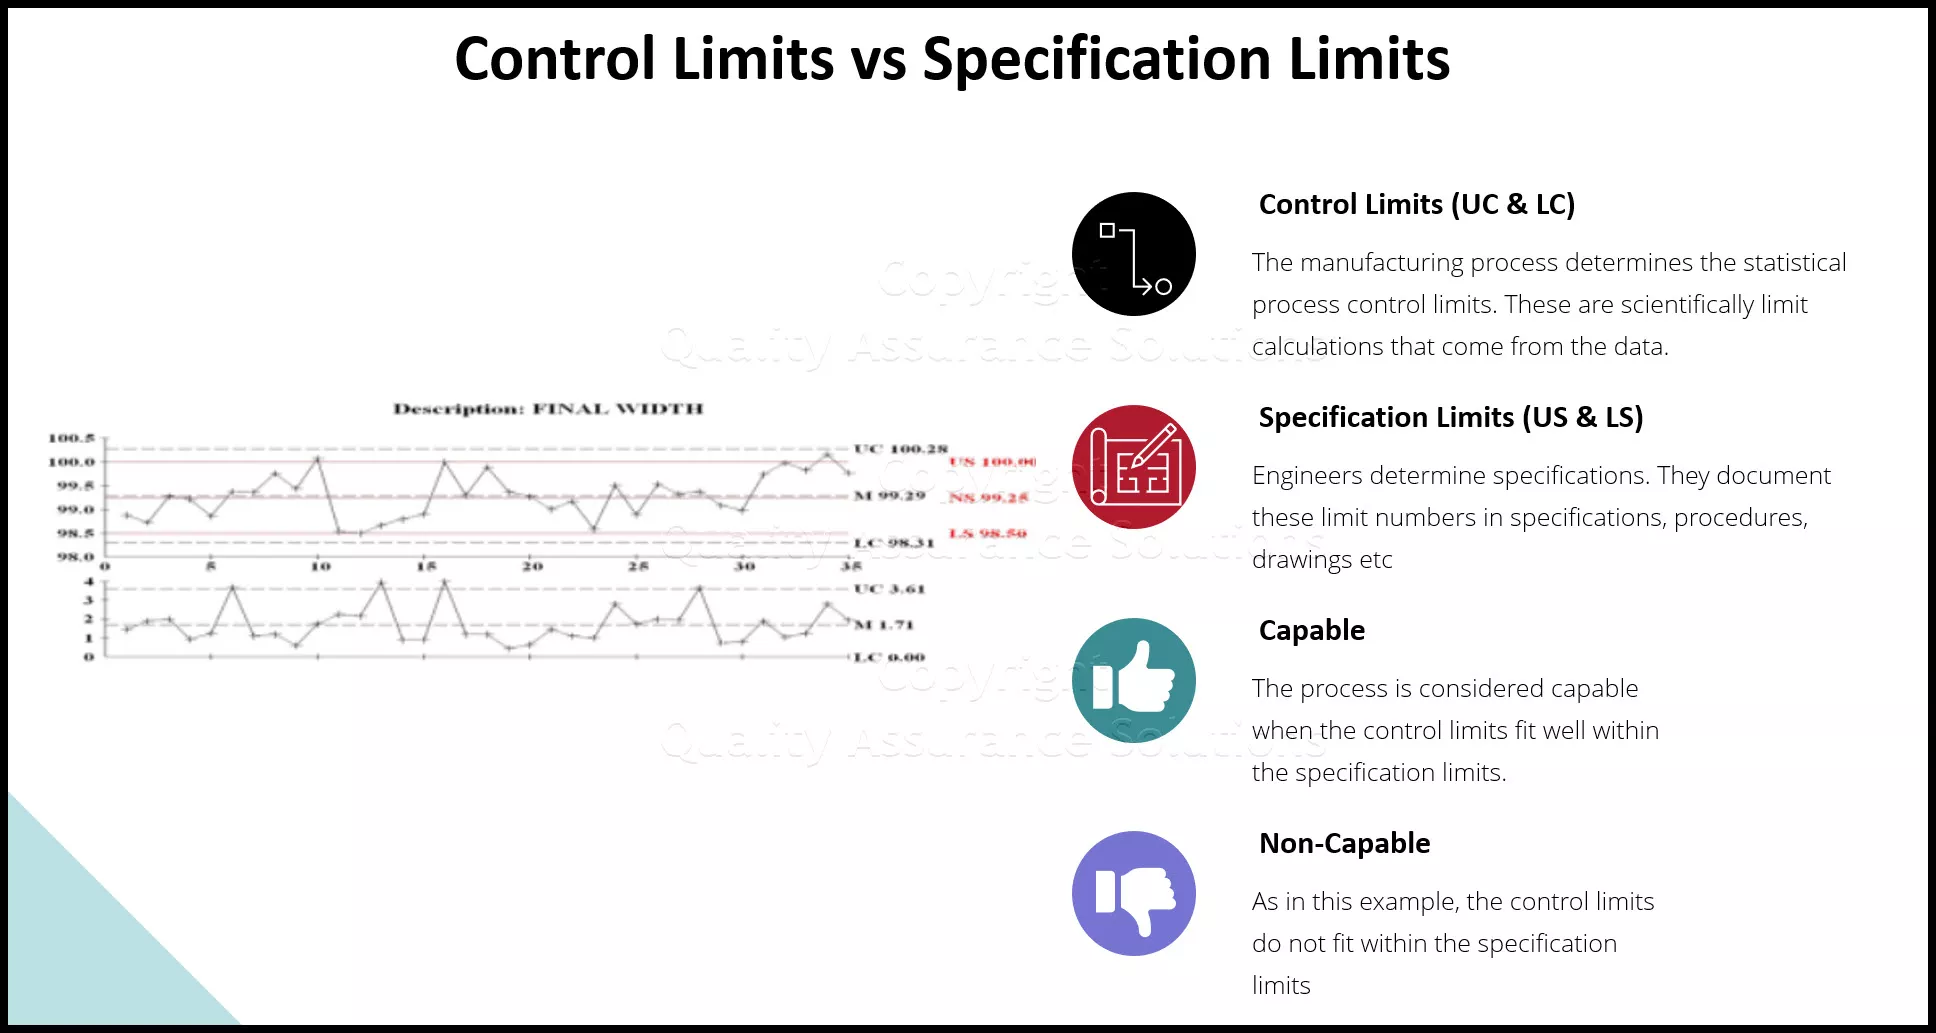
In the graph above you see the control limits (UC and LC) above and below the specification limits. In this case the process is not capable of meeting the specification. When this occurs you have a couple of choices to ship good material.
- Change the manufacturing process
- Change the specification
- Conduct 100% inspection
- Stop shipment of the product
Learn SPC in an hour. Train your employees. Improve your processes and products. Prevent defects and save your company money.
Non-Capable Process Example
If you examine a mechanical drawing you see tolerance callouts for each dimension. These tolerance callouts are specifications.
Many times, these specifications relate to the number of significant decimal points for that dimension on the drawing. For example lets say the tolerance is 3. if the target dimension is written as 1.000” then the 3 significant decimal points means the allowed tolerance is +/- .003. If the target is written as 1.00” then the allowed tolerance is +/- .03
As described above, when tying significant digits to specifications, there exists a possibility that there is a non-capable process. Why is this?
AutoCad operators normally create the drawings. Although experts with the AutoCad software, they are not experts with the process capability. They have not been trained in control chart SPC. They learned tolerances but not process control and control charts.
The drawing specifications are arbitrary and only based on significant digits. Only the manufacturing process determines the true output measurements for that given dimension. The drawing's specification has no relationship to the manufacturing capability.
After reviewing this page on control chart SPC, see here for more on the SPC definition.
Comments
|
Quality Assurance Solutions Robert Broughton (805) 419-3344 USA |
 |
|
Software, Videos, Manuals, On-Line Certifications | ||
|
An Organizational Task Management System. Projects, Meetings, Audits & more | ||
|
Corrective Action Software | ||
|
Plan and Track Training | ||
|
AQL Inspection Software |
|
450+ Editable Slides with support links | ||
|
Learn and Train TRIZ | ||
|
Editable Template | ||
|
Templates, Guides, QA Manual, Audit Checklists | ||
|
EMS Manual, Procedures, Forms, Examples, Audits, Videos | ||
|
On-Line Accredited Certifications Six Sigma, Risk Management, SCRUM | ||
|
Software, Videos, Manuals, On-Line Certifications |


No one has commented yet. Be the first!