Measure Tollgates
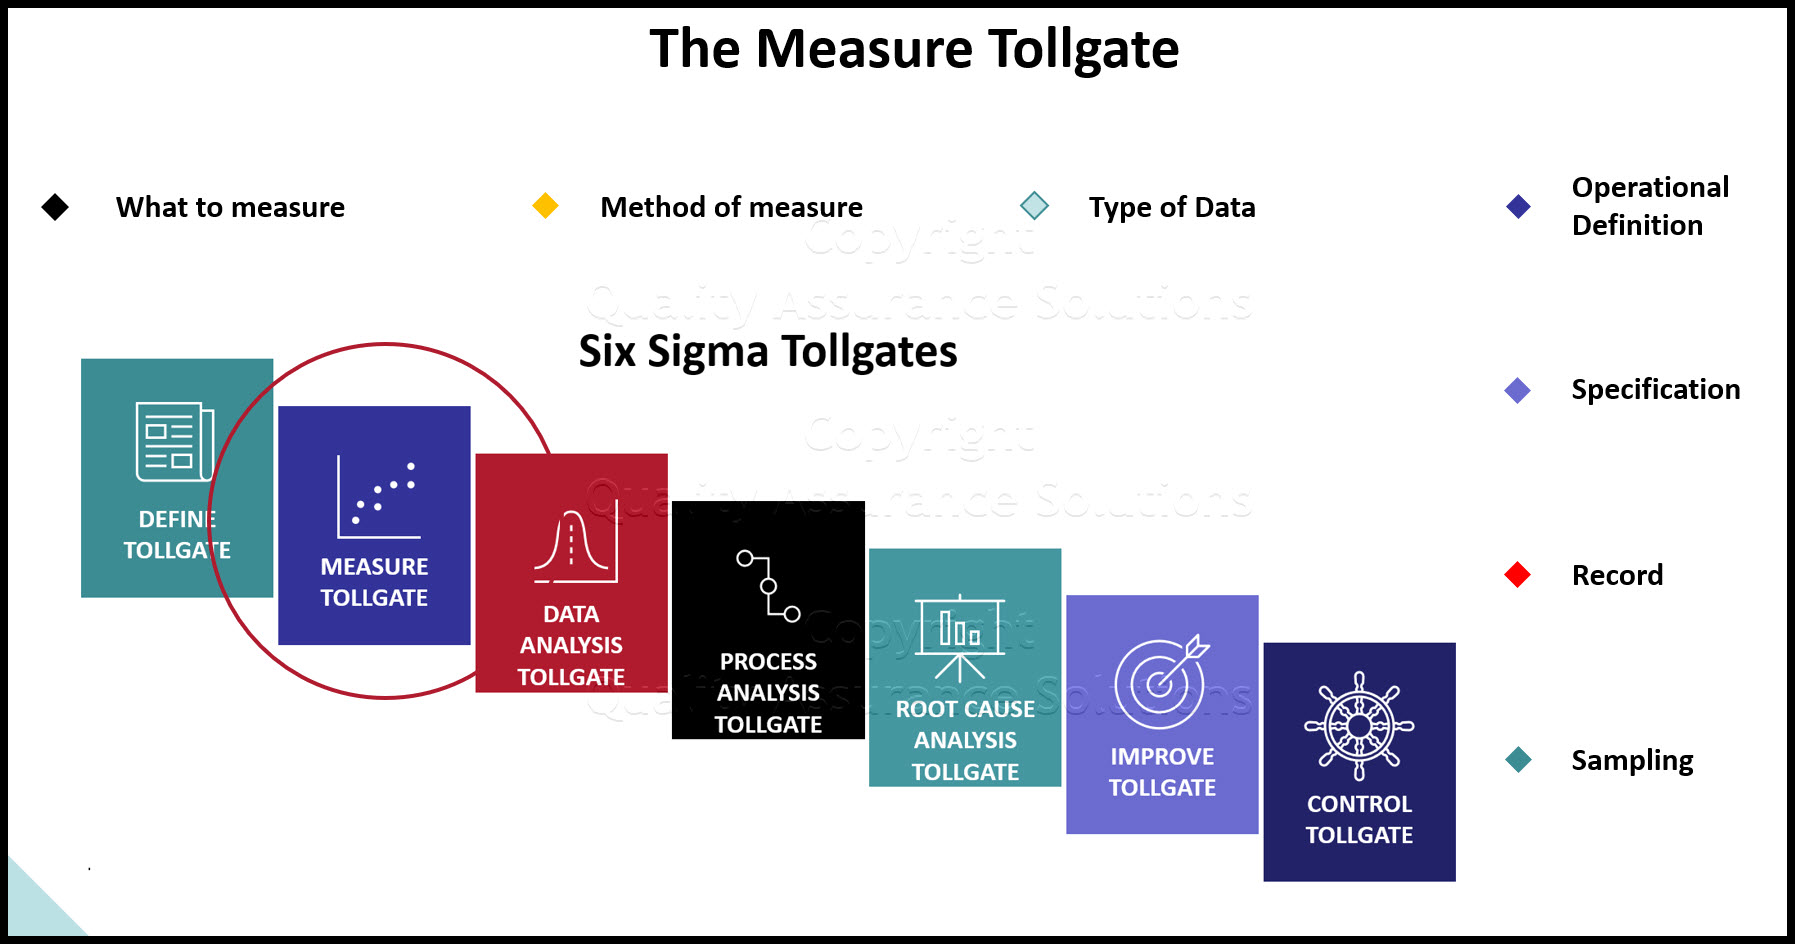
Six Sigma's DMAIC second step is Measure Tollgates. Here you calculate the current sigma performance. There are two major measure tollgates, the creation of the data collection plan and the implementation of the data collection plan.
Creation of the Data Collection Plan
On a spreadsheet, the data collection plan has 7 columns. Each column details an important role in helping the team calculate the baseline sigma. Below we list the columns and their definition:
1) What to measure: In the first column of the data collection plan, the team should take the requirements determined in the Define stage of DMAIC and place them in this first column.
2) The method of measure: This second column decribes how one gathers the data. For example a scale or caliper.
3) The type of data: There are two types of data. The first type of data is discrete data. Discrete data is binary, off/on, good/bad, male/female. Continuous data refers to data that exists on a continuum such as height, weight, minutes, days, length, and so on. Continuous data is preferred over discrete data because it tells us more about a process.
4) Operational definitions: The operational definition describes the measurement. Make the definition clear with no ambiguity so all involved have a common understanding of the measurement.
5) Targets/specifications: Record the customer's ideal target performance of the product or service.
6) Data collection forms: Record the document number or name.
7) Sampling: Sampling is the process of taking only a proportion of the total population of available data. Use sampling when measuring the entire population would either be too expensive or take too much time. Record sample size and frequency. To ensure correct sampling, take a random sample representative of the larger population.
2. Implementation of the Data Collection Plan
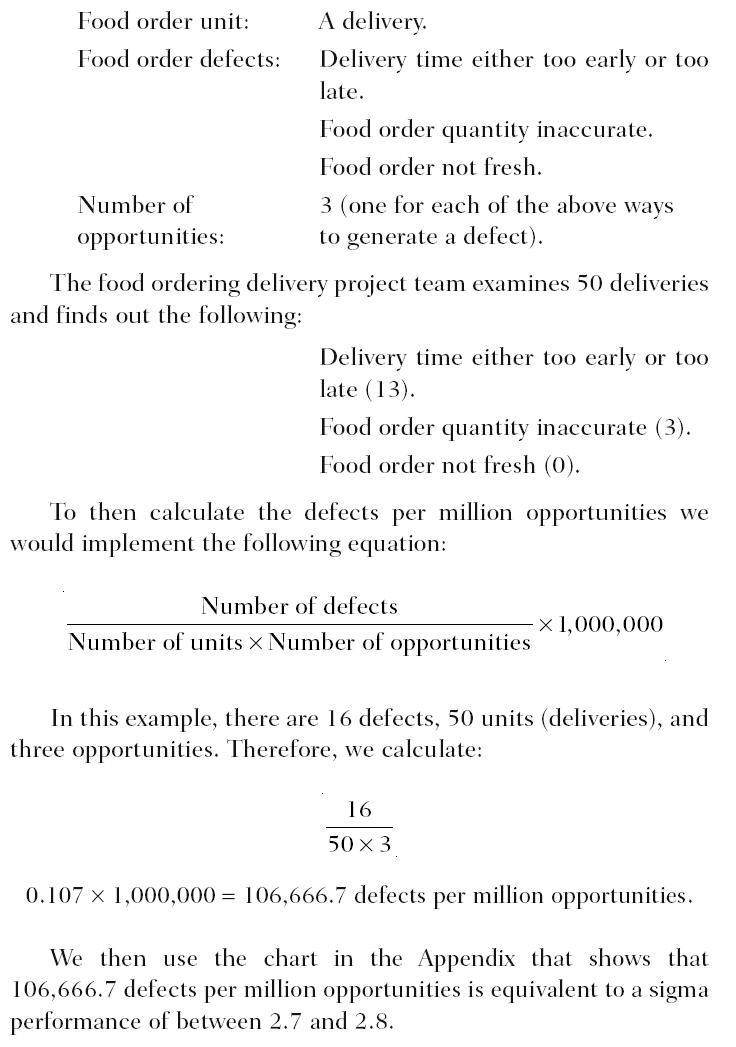
For the second tollgate you implement the data collection plan to generate the baseline sigma: There are several methods to calculate baseline sigma. The easiest way is to determine what a unit, defect, and opportunity is for your project (defects per million opportunities). See below for an example.

More on Data Collection Forms and Measure Tollgates
In general, there are two types of data collection forms. One is used for discrete data and the other used for continuous data.
There are four steps to using a discrete data collection form:
1. Define the defect.
2. Determine categories of defects.
3. Determine the data collection time frame.
4. Create a data collection grid.
For continuous data, the Six Sigma project team should use a frequency distribution check sheet. This type of check sheet tracks the number of occurrences for a given event for each measurement or series of measurements
|
Quality Assurance Solutions Robert Broughton (805) 419-3344 USA |
 |
|
Software, Videos, Manuals, On-Line Certifications | ||
|
450+ Editable Slides with support links | ||
|
Corrective Action Software | ||
|
Plan and Track Training | ||
|
AQL Inspection Software |
|
Learn and Train TRIZ | ||
|
Editable Template | ||
|
Templates, Guides, QA Manual, Audit Checklists | ||
|
EMS Manual, Procedures, Forms, Examples, Audits, Videos | ||
|
On-Line Accredited Certifications Six Sigma, Risk Management, SCRUM | ||
|
Software, Videos, Manuals, On-Line Certifications |


