Process Decision Program Chart
Description:
The Process decision program chart (PDPC) systematically identifies what might go wrong in a plan under development.
Countermeasures are developed to prevent or offset those problems. By using PDPC, you can either revise the plan to avoid the problems or be ready with the best response when a problem occurs.
When to Use:
Before implementing a plan, especially when the plan is large and complex.
When the plan must be completed on schedule.
When the price of failure is high.
8D Manager Software with 8D, 9D, 5Y and 4M report generator. Your corrective action software for managing, measuring, and reporting issues.
Process Decision Program Chart Construction:
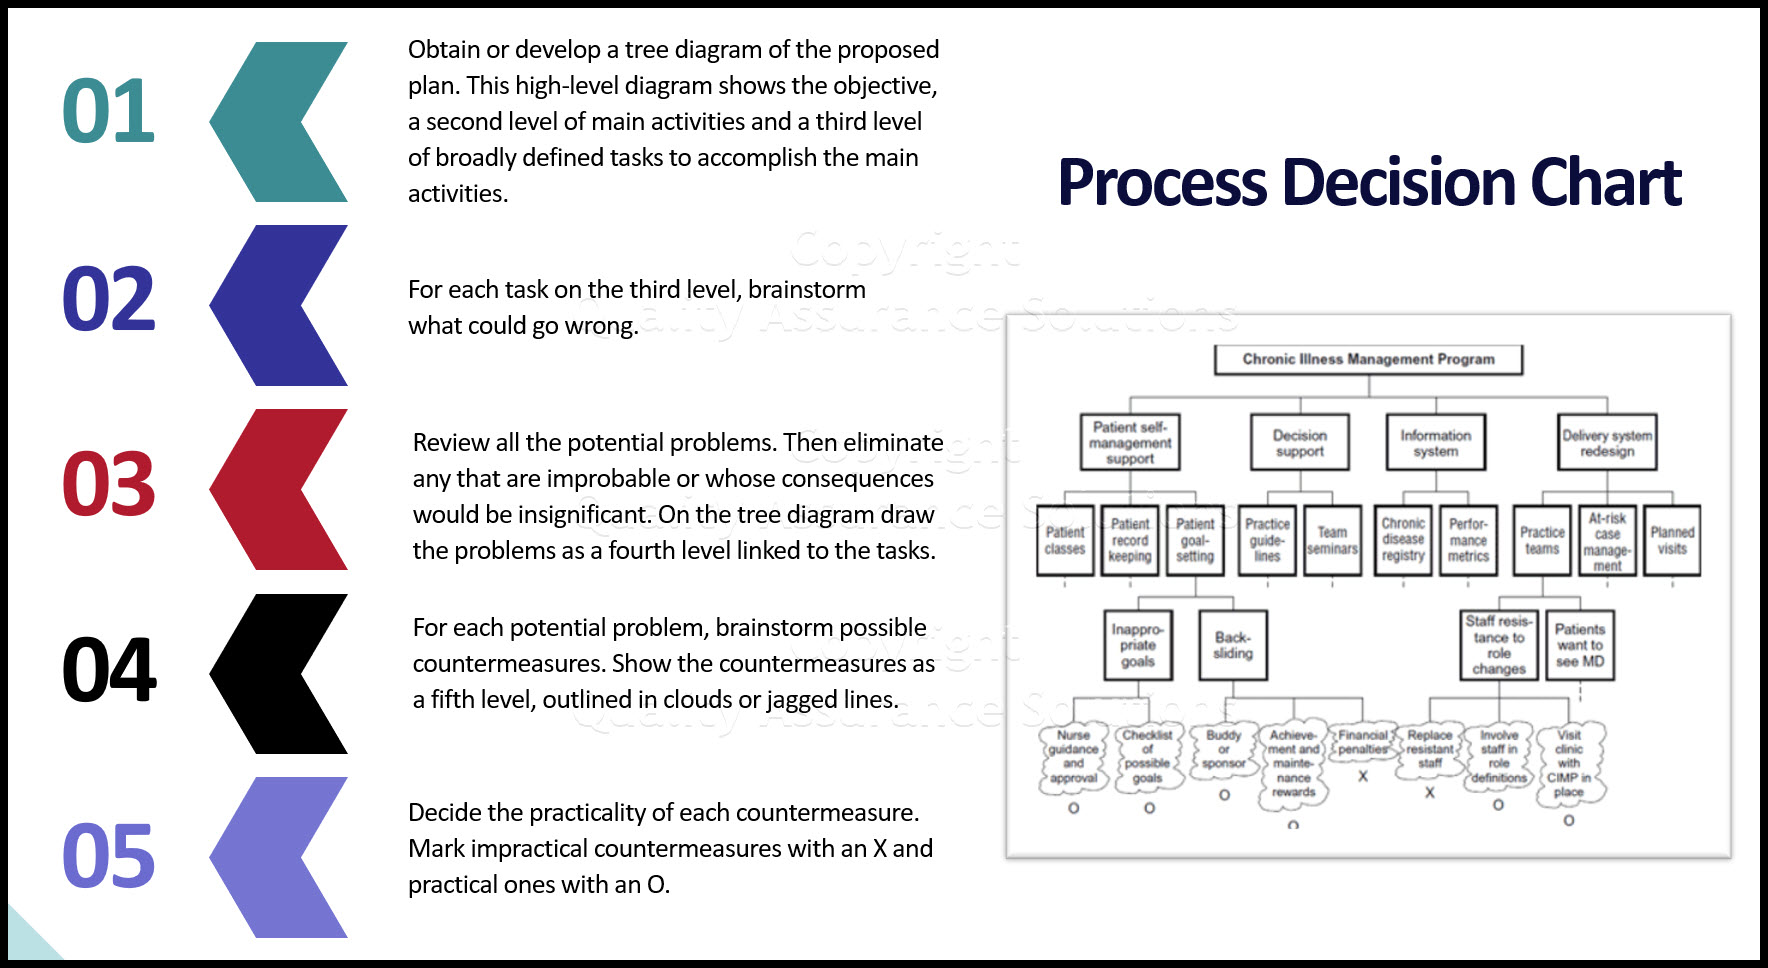
Obtain or develop a tree diagram of the proposed plan. This high-level diagram shows the objective, a second level of main activities and a third level of broadly defined tasks to accomplish the main activities.
For each task on the third level, brainstorm what could go wrong.
Review all the potential problems. Then eliminate any that are improbable or whose consequences would be insignificant. On the tree diagram draw the problems as a fourth level linked to the tasks.
For each potential problem, brainstorm possible countermeasures. These might be actions or changes to the plan that would prevent the problem, or actions that would remedy it once it occurred. Show the countermeasures as a fifth level, outlined in clouds or jagged lines.
Decide the practicality of each countermeasure. Use criteria such as cost, time required, ease of implementation and effectiveness. Mark impractical countermeasures with an X and practical ones with an O.
Questions to Identify Problems:
What inputs must be present? Are there any undesirable inputs linked to the good inputs?
What outputs are we expecting? Might others happen as well?
What is this supposed to do? Is there something else that it might do instead or in addition?
Does this depend on actions, conditions or events? Are these controllable or uncontrollable?
What cannot be changed or is inflexible?
Have we allowed any margin for error?
What assumptions are we making that could turn out to be wrong?
What has been our experience in similar situations in the past?
How is this different from before?
If we wanted this to fail, how could we accomplish that?
8D Manager Software with 8D, 9D, 5Y and 4M report generator. Your corrective action software for managing, measuring, and reporting issues.
Example:
A medical group is planning to improve the care of patients with chronic illnesses such as diabetes and asthma through a new chronic illness management program (CIMP).
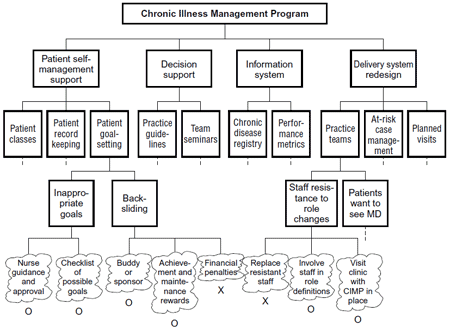
They have defined four main elements. For each of these elements they laid the information out in the process decision program chart below.
Dotted lines represent omitted sections of the chart. The chart only shows some of the potential problems and countermeasures identified by the planning.

For example, one of the possible problems with patients goal-setting is backsliding. The team liked the idea of each patient having a buddy or sponsor. The team adds this to the program design.
Another areas of the chart helped them plan better rollout, such as arranging for all staff to visit a clinic with a CIMP program in place.
The chart allowed them to plan in advance for problems, such as training the CIMP nurses on the method to counsel patients who choose inappropriate goals.
|
Quality Assurance Solutions Robert Broughton (805) 419-3344 USA |
 |
|
Software, Videos, Manuals, On-Line Certifications | ||
|
450+ Editable Slides with support links | ||
|
Corrective Action Software | ||
|
Plan and Track Training | ||
|
AQL Inspection Software |
|
Learn and Train TRIZ | ||
|
Editable Template | ||
|
Templates, Guides, QA Manual, Audit Checklists | ||
|
EMS Manual, Procedures, Forms, Examples, Audits, Videos | ||
|
On-Line Accredited Certifications Six Sigma, Risk Management, SCRUM | ||
|
Software, Videos, Manuals, On-Line Certifications |


